Figure 5.
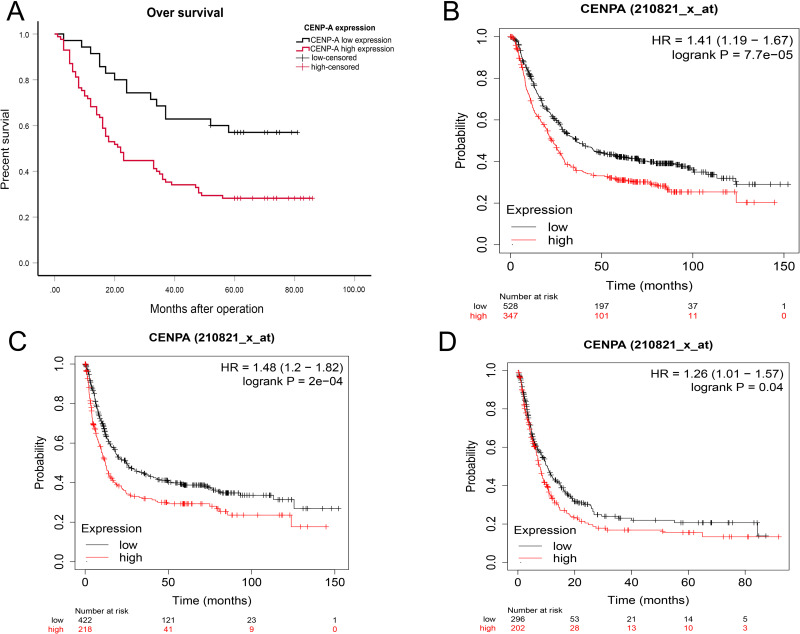
Prognostic roles of CENP-A in gastric cancer. (A) Survival curves are plotted for gastric cancer patients (n =120). (B) The Kaplan-Meier plotter indicated that the GC patients with overexpressed CENP-A had significantly worse OS. (C) The Kaplan-Meier plotter showed the CENP-A high expression group had worse first progress (FP). (D) The Kaplan-Meier plotter revealed CENP-A upregulation correlated with worse post-progression survival (PPS).

