
Figure 3. Mad1-Mad2 targets Cdc20 in the cytoplasm to promote the G2-to-M transition.
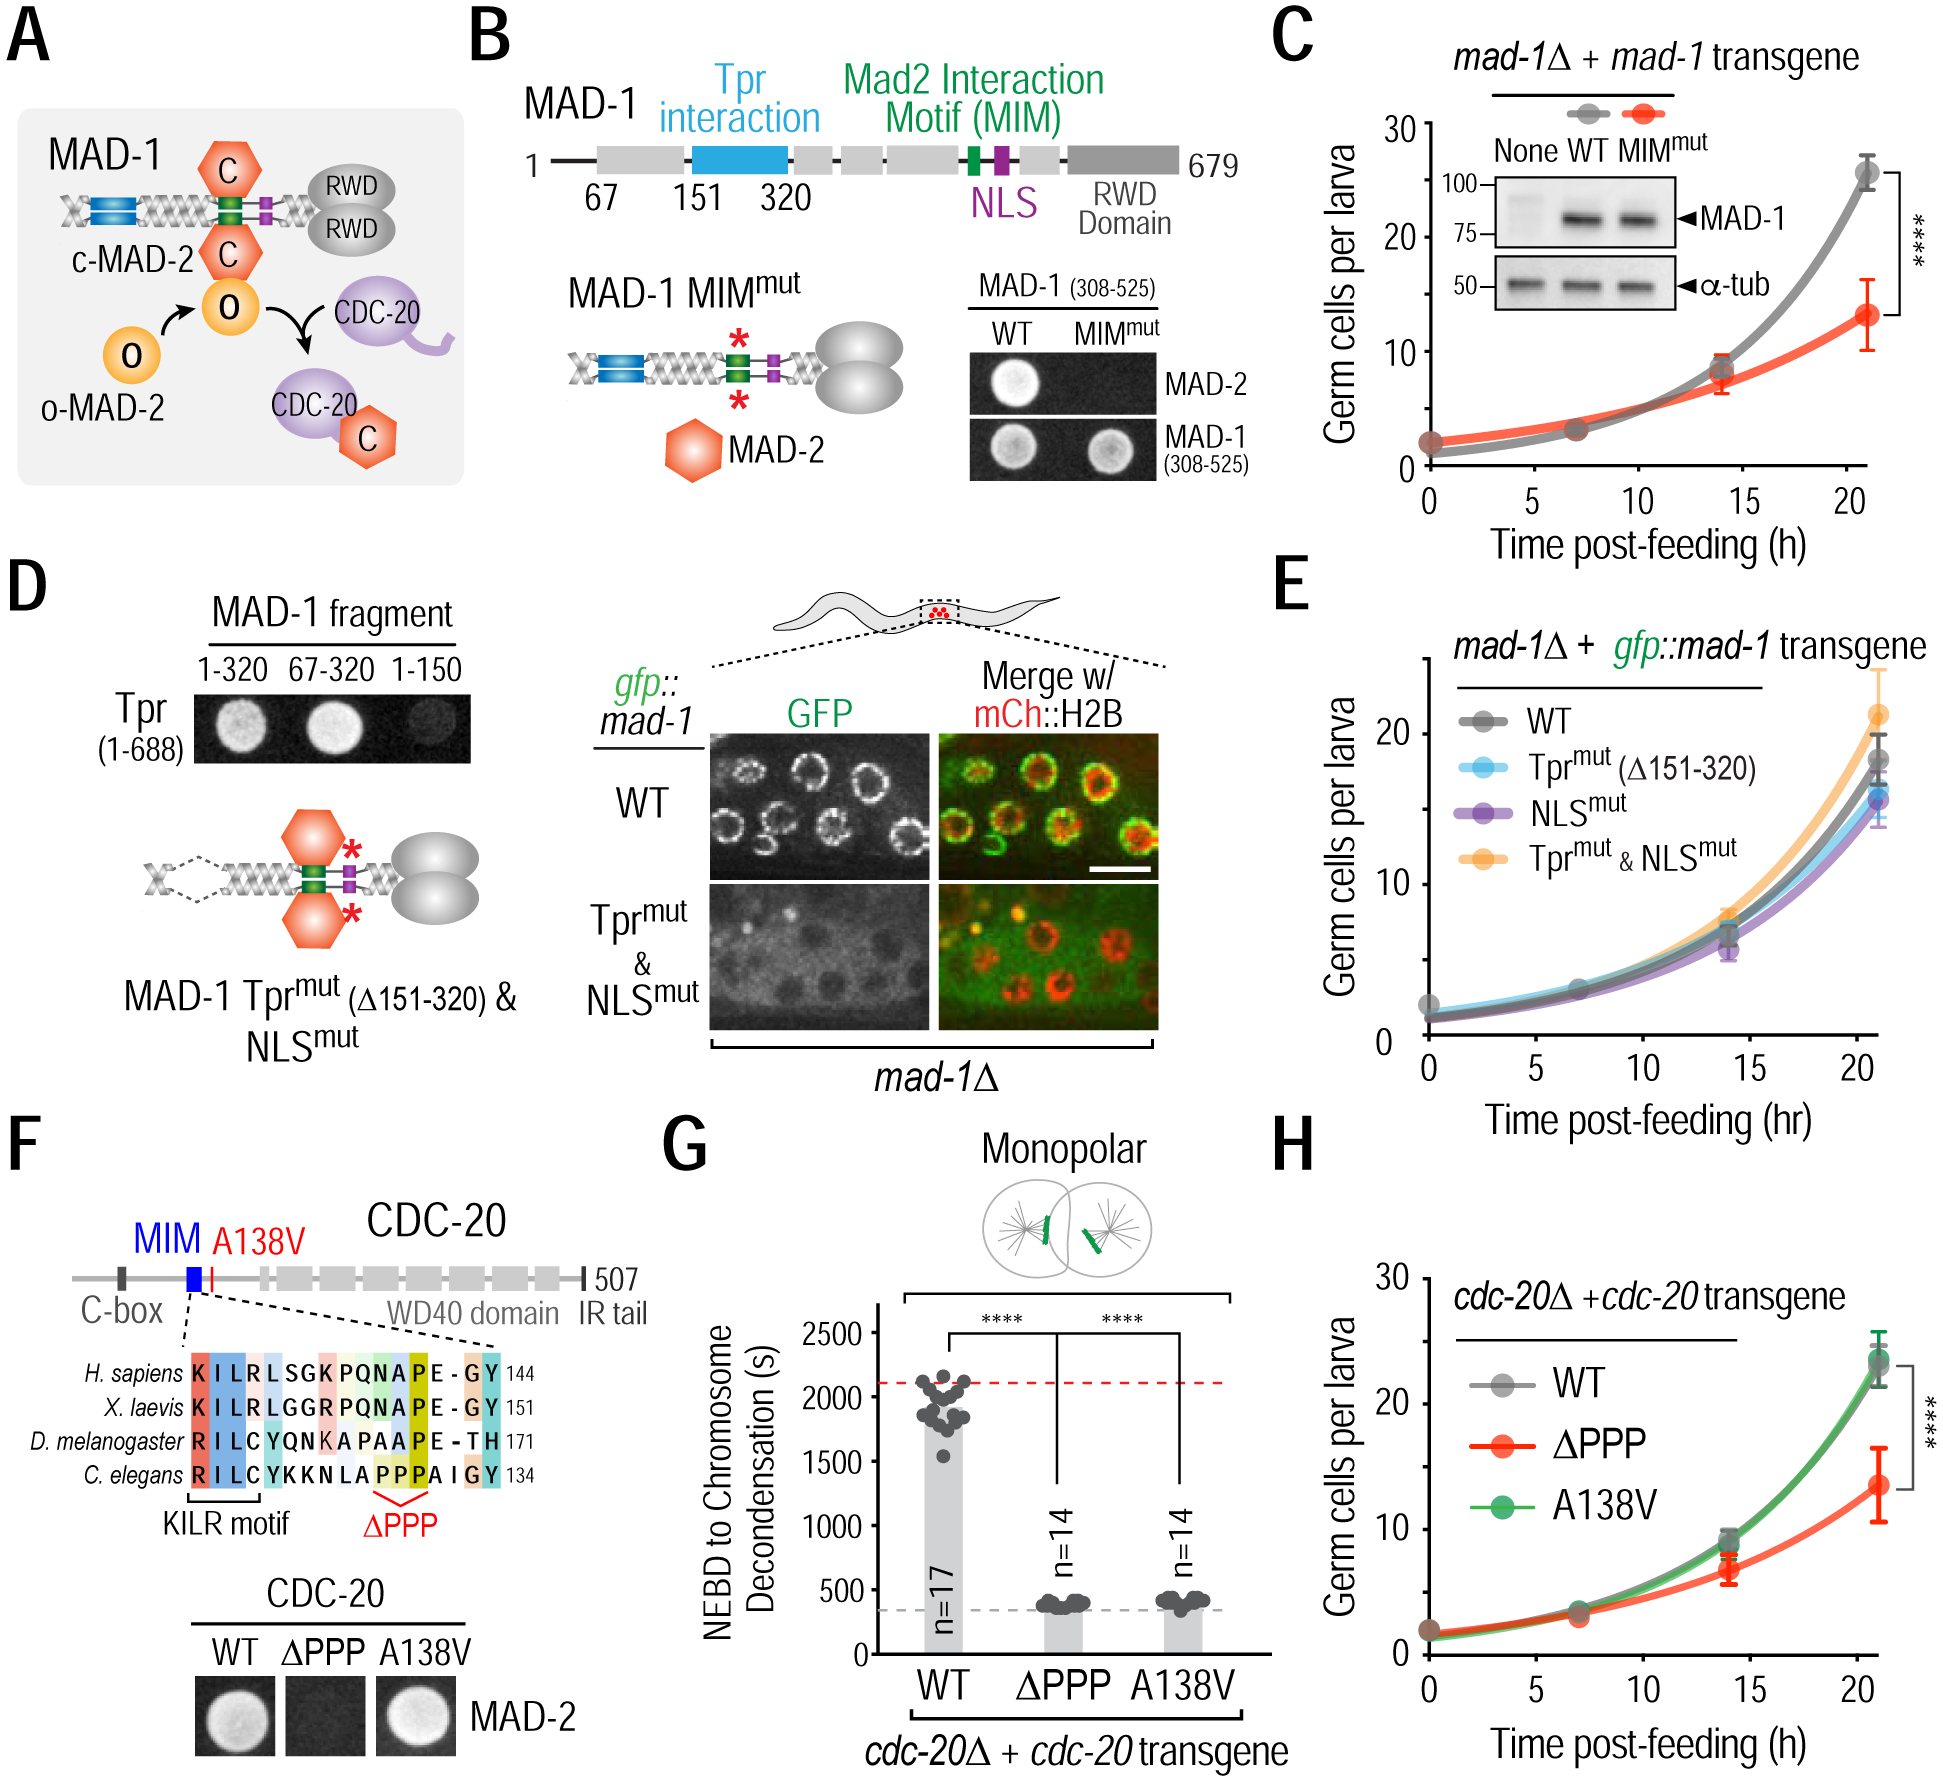
(A) Schematic of Mad1-Mad2-mediated catalysis of Mad2-Cdc20 complex formation. (B) (top) Schematic of MAD-1 primary structure highlighting MAD-2 interaction motif (MIM, green), Tpr interaction domain (sky blue), and nuclear localization signal (NLS, purple). (bottom left) Schematic of MIMmut MAD-1; see Fig. S3A for details on MIM mutant generation; (bottom right) Yeast two-hybrid data showing the effect of mutating the MIM in MAD-1. (C) Effect of mutating MAD-1’s MIM on germ cell proliferation. Inset shows immunoblot of mad-1Δ strains expressing WT or MIMmut MAD-1 from single copy transgene insertions. α-tubulin serves as a loading control. (D) (left top) Yeast two hybrid data mapping the interaction of MAD-1 with Tpr (NPP-21) to residues 151–320 and (left bottom) schematic of MAD-1 mutant engineered to disrupt Tpr interaction and nuclear transport; see Fig. S3A for details on NLS mutant generation; (right) Disruption of MAD-1 nuclear periphery and nuclear interior localization in germ cells by deletion of the Tpr interaction domain and mutation of the NLS. Bar, 5 μm. (E) Effect of disrupting MAD-1 nuclear periphery and/or nuclear interior localization on germ cell proliferation. (F) (top) Schematic of the CDC-20 region important for MAD-2 and APC/C-binding (KILR motif); the ΔPPP mutant selectively disrupts MAD-2 binding. (bottom) Yeast-two hybrid data showing the effect of the CDC-20 ΔPPP mutant on its interaction with MAD-2. (G) & (H) Checkpoint signaling (G) and germ cell proliferation (H) analysis in the indicated CDC-20 mutants. Dashed lines indicate average mitotic duration in bipolar (grey) and monopolar (red) controls. (C,E,H) Germ cell proliferation in 15 or more larvae was quantified at each time point; (G) n is number of embryos scored for mitotic duration. All error bars are 95% confidence intervals. **** represents p<0.0001 from Mann-Whitney tests. See also Figures S3 and S4.