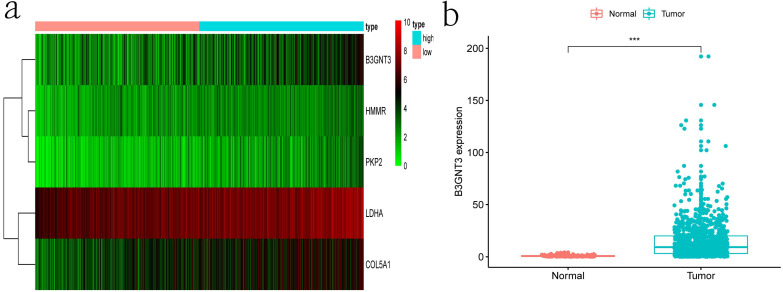
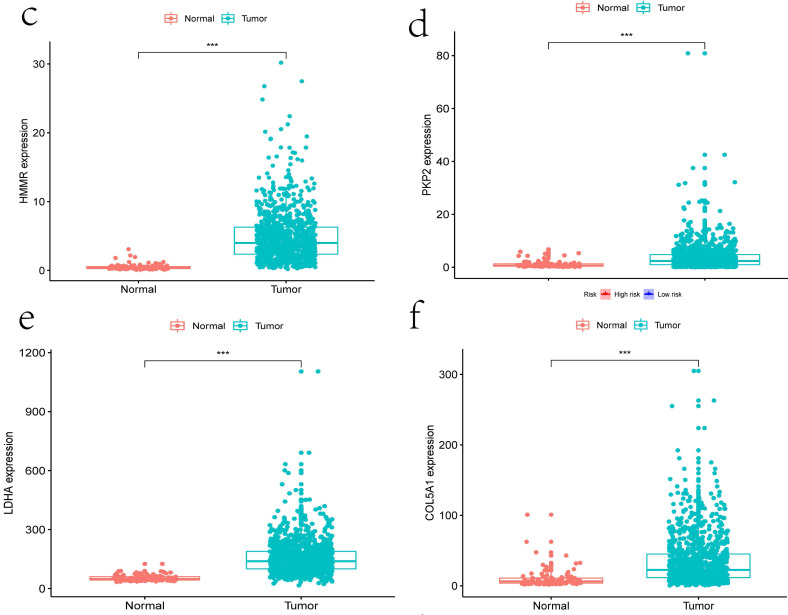
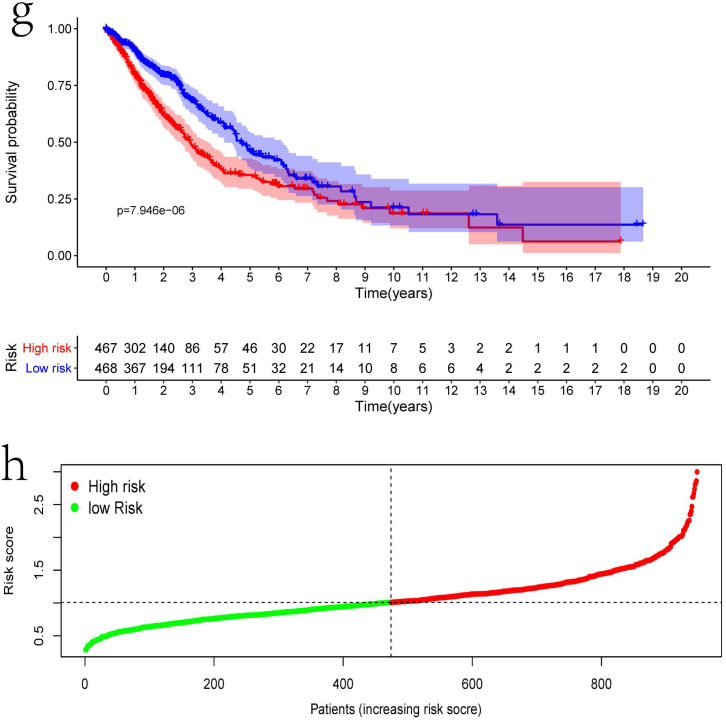
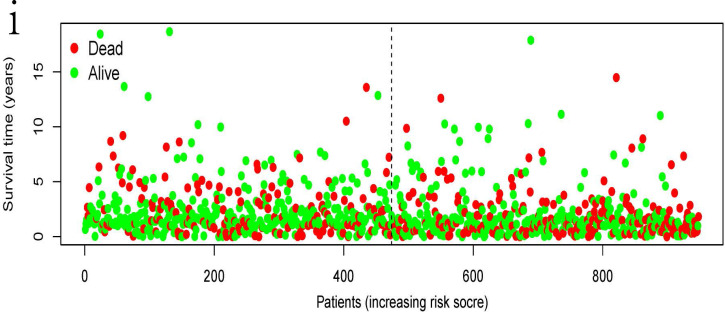
Figure 3.
The expression patterns of five genes in the signature. a) Heatmap of five genes expression profiles. b-f) Different expression of five genes in the normal tissue and tumor tissue based on TCGA (*** represents P<0.001). g) Kaplan-Meier curve for NSCLC patients with high/low risk. h) Risk score distribution. I) Survival status distribution.


