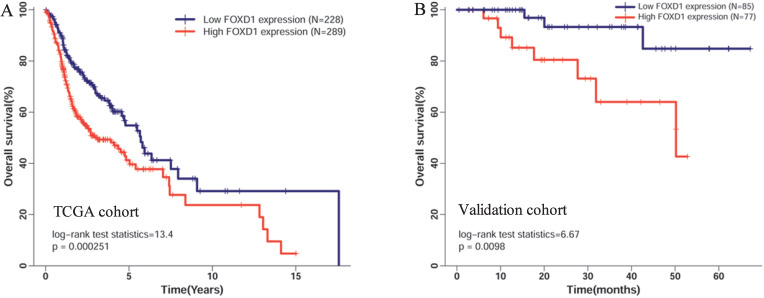
Figure 3.
Kaplan-Meier curves of overall survival in patients with HNSCC with high and low FOXD1 expression in (A) the TCGA cohort and (B) the validation cohort. Overall survival time in the high FOXD1 expression group was shorter than that in the low expression group in TCGA database (Log-rank P = 2.51E-4). The Kaplan-Meier curve of the validation cohort showed that high FOXD1 expression was associated with significantly worse OS (Log-rank P = 0.01).

