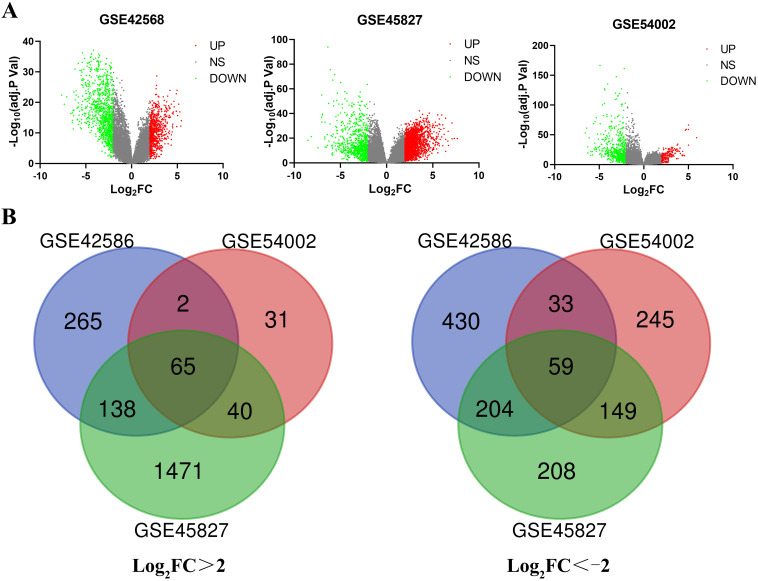
Figure 1.
Identification of the DEGs in three datasets (GSE42568, GSE45827 and GSE54002). (A) The volcano map for each dataset; red dots indicate upregulated DEGs; green dots represent downregulated DEGs; and gray dots indicate nonsignificant (NS) DEGs. (B) A total of 124 common DEGs were identified in an online Venn diagram tool. Different colors represent different datasets. Sixty-five overlapping upregulated DEGs in the three datasets (log2FC > 2) and 59 overlapping downregulated DEGs in the three datasets (log2FC < -2) were identified.

