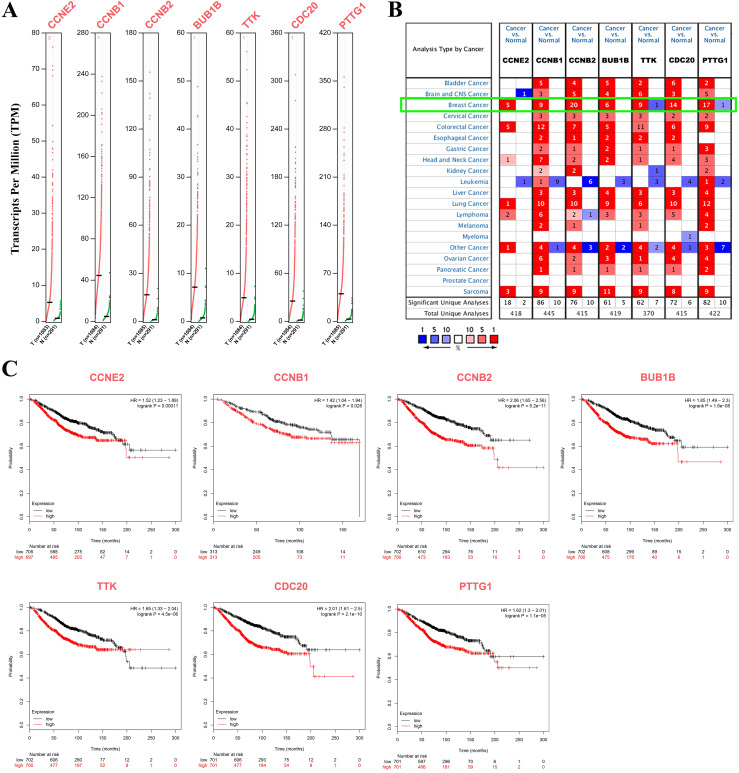
Figure 3.
Transcription and survival analysis of hub genes. (A) Transcription levels of seven cell cycle-related hub genes via GEPIA (p<0.05); red dots represent BC samples, and green dots represent normal tissue samples. (B) Transcriptional expression of seven CCRGs was significantly high in BC (p<0.01, green frame, Oncomine™ database). Numbers represent the significantly differential expression datasets. (C) Survival analysis of seven CCRGs via KM plotter (p<0.05); the red line represents high expression, and the dark line represents low expression in BC patients.

