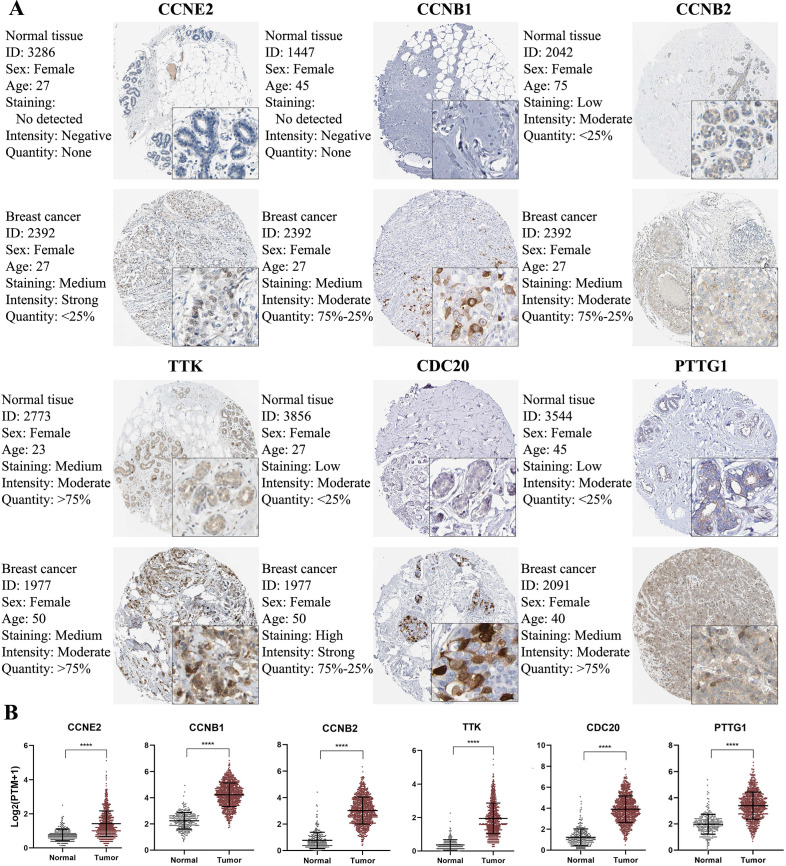
Figure 7.
IHC analysis and RNA expression analysis of genes with prognostic values. (A) Differentially expressed proteins of genes with prognostic values in normal and BC tissues in the Human Protein Atlas database. (B) RNA expression of genes with prognostic values between normal and BC tissues in the Human Protein Atlas database. Significance was tested by the Student's t‑test (****p < 0.0001; number of normal samples and tumor samples were 290 and 1075, respectively).

