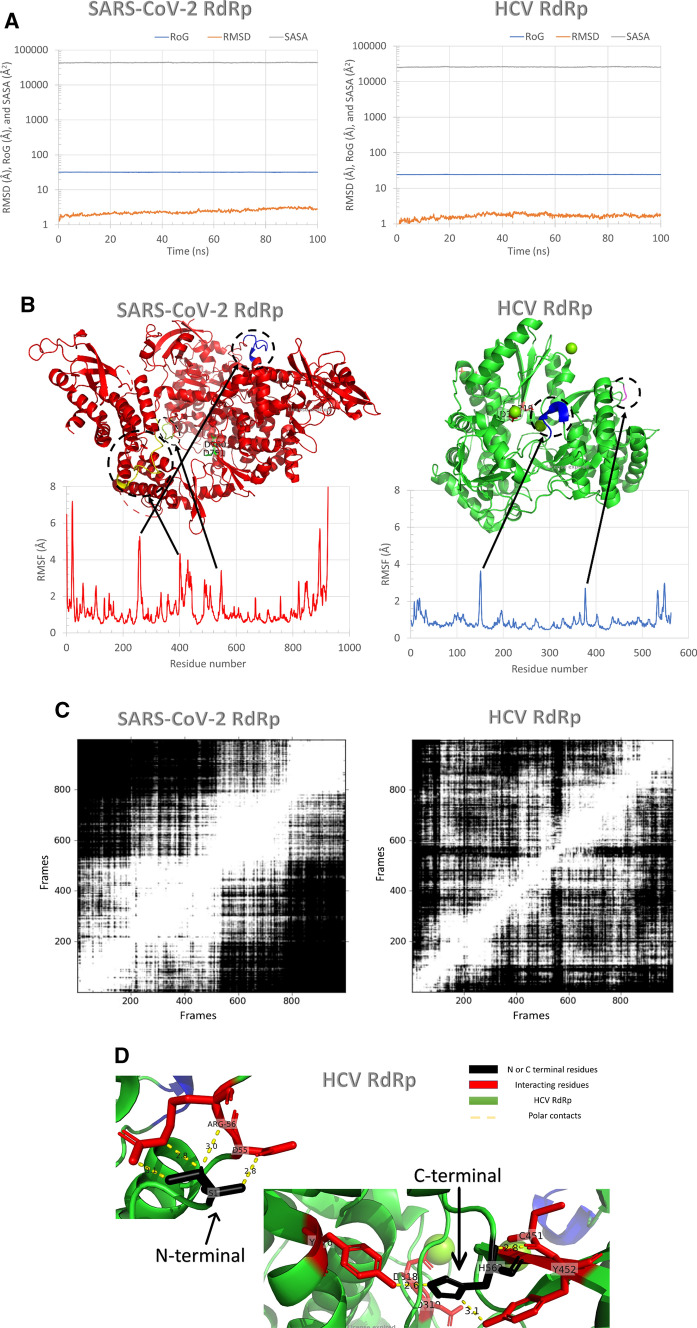
Fig. 1.
Molecular Dynamics Simulation studies for SARS-CoV-2 and HCV RdRp. a RMSD (orange), RoG (blue), and SASA (gray) for both systems versus time in nanoseconds during the 100 ns simulation. b per residue RMSF during the simulation. RdRp structures are shown in the colored cartoon. c RMSD Map of the dynamics of the SARS-CoV-2 RdRp (left) and HCV RdRp during the 100 ns by using UCSF Chimera software. d N and C terminals of HCV RdRp and its interactions with the protein residues inside the protein

