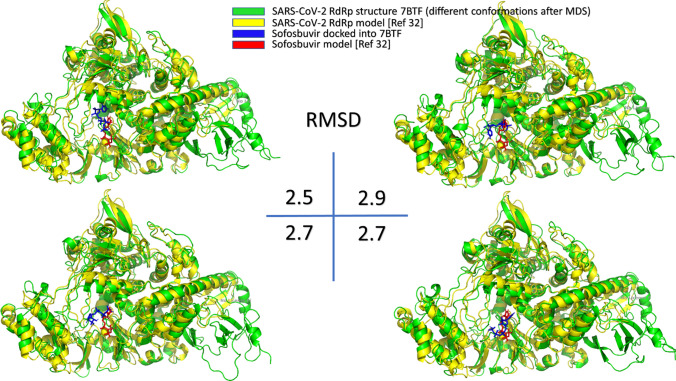
Fig. 5.
The superposition of the docking of sofosbuvir (blue and red sticks) into the RdRp model (yellow cartoon) and four different conformations of the RdRp solved structure (PDB ID: 7BTF) subjected to 100 ns MDS (green cartoon). The RMSD values (in Å) for each pair is shown at the center of the figure

