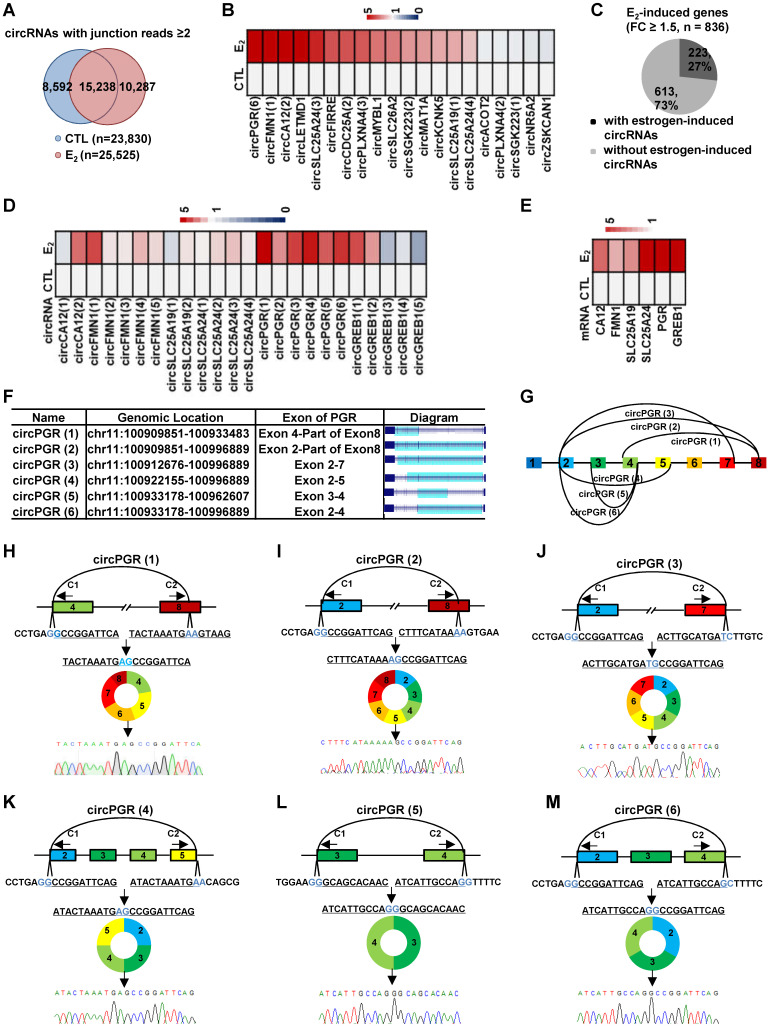
Figure 2.
A large number of circRNAs are induced by estrogen. (A) Venn diagram showing overlapping between circRNAs predicted in both control (CTL) and estrogen (E2)-treated conditions (junction reads ≥ 2, FC ≥ 2). (B) RNA samples as described in Figure 1A were subjected to RT-qPCR analysis using divergent primer sets flanking circRNA junction regions to examine the expression of estrogen-induced circRNAs. Genomic location information on all circRNAs shown could be found in Supplementary Table 1. (C) Estrogen-induced genes (FC ≥ 1.5) were determined based on regular RNA-seq performed in parallel, and estrogen-induced gene regions with or without detectable estrogen-induced circRNA were shown by pie chart. (D) RNA samples as described in Figure 1A were subjected to RT-qPCR analysis using divergent primer sets flanking circRNA junction regions to examine the expression of circRNAs generated from estrogen-induced genes as indicated. Genomic location information on all circRNAs shown could be found in Supplementary Table 1. (E) RNA samples as described in Figure 1A were subjected to RT-qPCR analysis to examine the expression of estrogen-induced parental genes corresponding to those circRNAs shown in (D). (F) Genomic location and schematic representation of the six circRNAs, circPGR (1) to circPGR (6), originated from PGR gene. CircRNA was highlighted in light blue. (G) Diagram showing the six circRNAs originated from PGR gene. (H-M) RNA samples from estrogen-treated MCF7 cells as described in Figure 1A was subjected to reverse transcription, and standard PCR was performed by using divergent primer sets flanking the junction regions of circPGRs, followed by Sanger sequencing. Sequence flanking junction regions was shown. Junction sites were highlighted in light blue. Sanger sequencing histogram was shown at the bottom. C1: convergent primer 1; C2: convergent primer 2.

