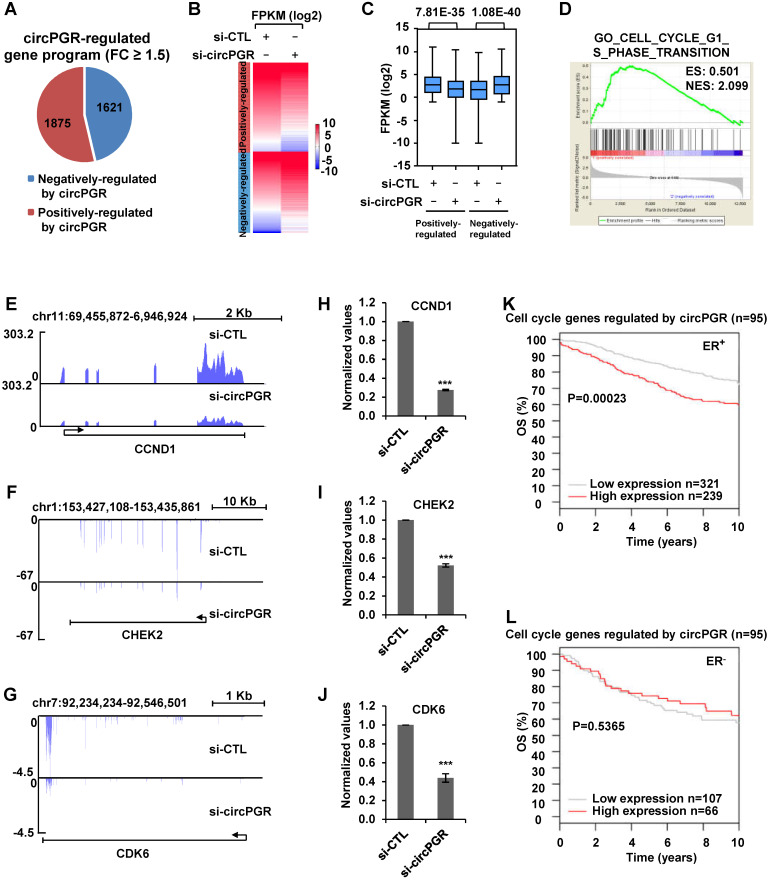
Figure 5.
Transcriptomics analysis reveals that circPGR regulates the expression of a cohort of cell cycle genes. (A) MCF7 cells were transfected with control siRNA (si-CTL) or siRNA specific against circPGR (si-circPGR) followed by RNA-seq. Genes positively- and negatively- regulated by circPGR based on RNA-seq were shown by pie chart (fold change (FC) ≥ 1.5). (B, C) Heat map (B) and box plot (C) representation of the expression levels (FPKM (log2)) for genes positively- and negatively- regulated by circPGR based on RNA-seq as shown in (A). (D) The most enriched gene ontology (GO) term for genes positively-regulated by circPGR as revealed by GSEA gene ontology (GO) analysis. ES: enrichment score; NES: normalized enrichment score. (E-G) Genome browser views of RNA-seq as described in (A) for CCND1 (E), CHEK2 (F) and CDK6 (G) were shown. (H-J) RNA samples as described in (A) were subjected to RT-qPCR analysis to examine the expression of CCND1 (H), CHEK2 (I) and CDK6 (J) as indicated. Data shown were the relative fold change compared with control samples after normalization to actin (±s.e.m., ***P < 0.001). (K, L) Kaplan Meier survival analyses (OS, overall survival) for ER-positive (ER+) (K) and ER-negative (ER-) (L) breast cancer patients using circPGR-regulated cell cycle genes as input in GOBO.

