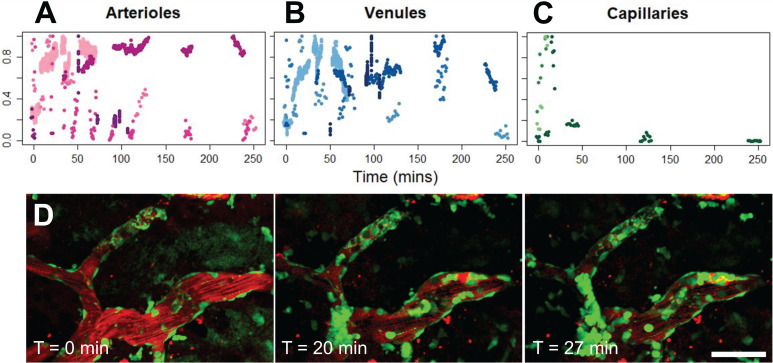
Figure 5.
Cell aggregate coverage of blood vessels, by blood vessel type. (A-C) Normalized proportion of cell aggregate coverage of blood vessels in arterioles (n = 5), venules (n = 5), and capillaries (n = 3), where each animal is represented by a different hue. (D) Example of cell aggregate in a venule. Blood vessel are shown in red (Texas Red dextran), and EGFP+ fluorescence cells are shown in green. Scale bar: 50 µm.

