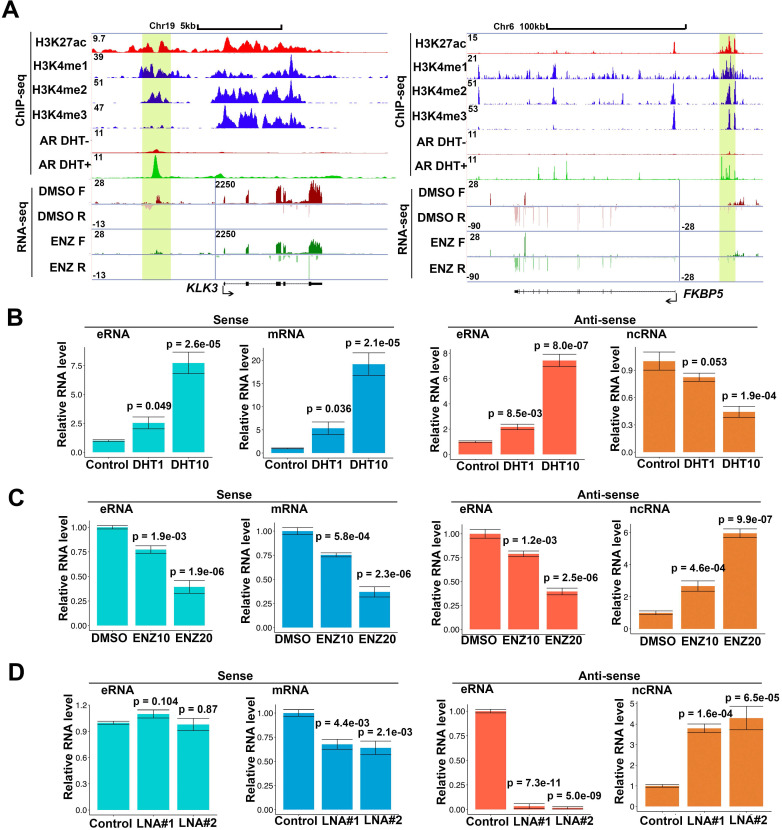
Figure 1.
Antisense eRNA is negatively related with antisense mRNA on AR target loci. (A) Screen shots from UCSC genome browser showing signal profiles of eRNA and mRNA expression in LNCaP. ChIP-seq in LNCaP and C4-2 were shown as a reference. PSA (KLK3) was in left panel; FKBP5 was in right panel. The enhancer regions were highlighted in yellow box. (B) Sense eRNA, sense mRNA, antisense eRNA (as-eRNA) and antisense ncRNA expressions of PSA were measured by qRT-PCR in C4-2 cells treated with DHT. Means and standard deviations (error bar) were determined from three replicates. Error bars represented mean ± SD for triplicate experiments. P values were shown in the figures. GAPDH as internal control. (C) Sense eRNA, sense mRNA, antisense eRNA (as-eRNA) and antisense ncRNA expressions of PSA were measured by qRT-PCR in C4-2 cells treated with enzalutamide (ENZ). Means and standard deviations (error bar) were determined from three replicates. Error bars represented mean ± SD for triplicate experiments. P values were shown in the figures. GAPDH as internal control. (D) Sense eRNA, sense mRNA, antisense eRNA (as-eRNA) and antisense ncRNA expressions of PSA were measured by qRT-PCR in C4-2 cells knocked down with antisense eRNA LNAs. Means and standard deviations (error bar) were determined from three replicates. Error bars represented mean ± SD for triplicate experiments. P values were shown in the figures. GAPDH as internal control.

