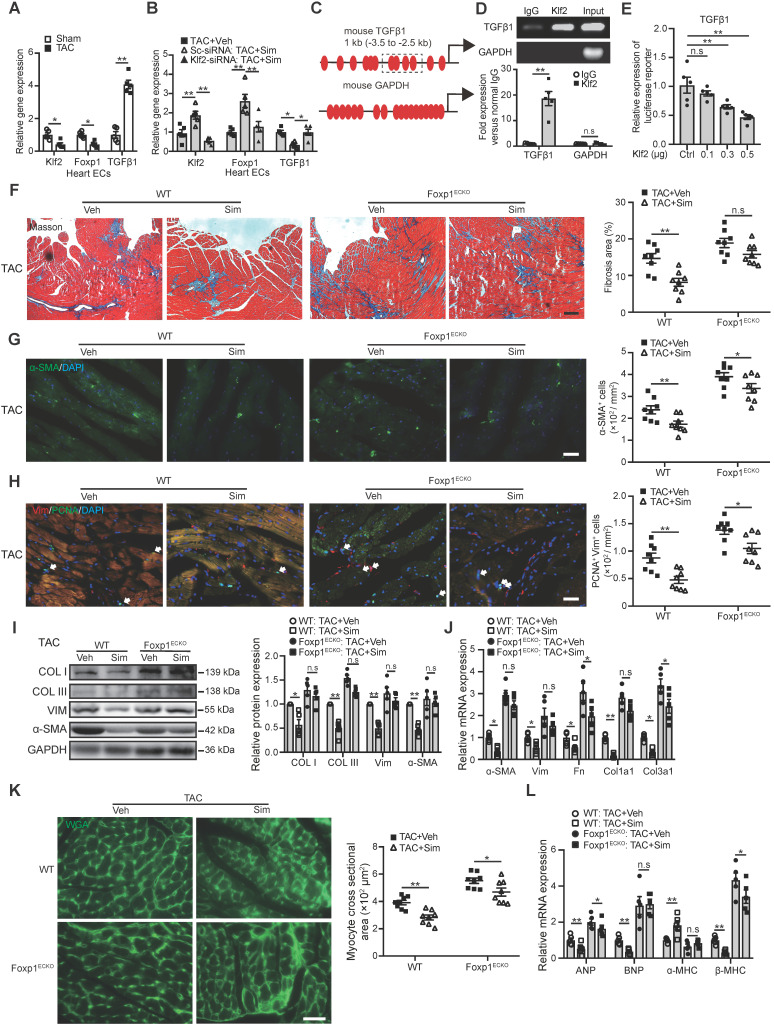
Figure 6.
Endothelial Klf2 or Klf2-Foxp1 transcription factor network directly represses TGFβ1 repression and mediates the inhibitory effects of simvastatin on TAC-induced pathological cardiac remodeling. A, RT-qPCR shows a significant reduction of Klf2 and fork head box protein 1 (Foxp1) but increase of TGFβ1 expression in cardiac microvasculature ECs of TAC heart compared with those of sham group. (n=5) B, Simvastatin significantly elevates EC-Klf2 and EC-Foxp1 but reduces EC-TGFβ1 expression compared with the vehicle control, and specific inhibition of Klf2 expression in cardiac microvasculature ECs in vivo by RGD-nanoparticles packaging Klf2-siRNA reverses the simvastatin-medicated elevation of EC-Klf2 and EC-Foxp1, as well as reduction of EC-TGFβ1 expression compared with the vehicle control. (n=5) C, Schematic diagram of Klf2 binding sites in the promoter of TGFβ1. The dashed box indicates the sequences amplified for luciferase reporter assay. D, Chromatin immunoprecipitation (ChIP) assay shows association of Klf2 and TGFβ1 by ChIP-qPCR (bottom) with agarose gel in the top (n=5). E, Luciferase reporter assay of TGFβ1 promoter region containing the Klf2 binding sites in NIH-3T3 cells (n=5). F, Masson's Trichrome staining shows reduction of simvastatin-mediated inhibition of cardiac fibrosis in Foxp1ECKO mutants compared with the littermate wild-type (WT) control mice, with representative image (left) and quantification (right) (n=8). G-J, EC-Foxp1 deletion reversal of the simvastatin-mediated inhibition of cardiac fibrosis correlates with the reversal of reduced α-SMA positive myofibroblast (G) (n=8), reduced fibroblast proliferation by PCNA/Vimentin double immunostaining (H) (n=8), and reduced expression of fibrotic genes, collagen type I, III and α-SMA by western blot (I) (n=5), as well as other ECM gene expression by RT-qPCR (J) (n=5). K-L, Endothelial specific Foxp1 deletion mice attenuates the simvastatin-mediated reduction of TAC-induced increased cardiomyocyte size by WGA staining (K) (n=8) and elevated expression of cardiac hypertrophic genes, ANP, BNP, β-MHC, but reduced α-MHC expression compared with the littermate wild-type control mice (L) (n=5). Data are means ±S.E.M. *P<0.05, **P<0.01 and n.s. not significant. Unpaired Student's t-test (A, D), 1-way ANOVA with Turkey test (B, E), 2-way ANOVA with Turkey test (F-L). Scale Bars: F, 100 µm; G, H, K, 50 µm.

