Fig. 3.

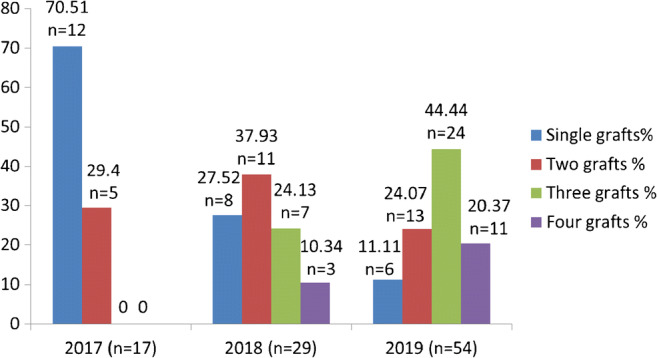
The graphical representation of number of grafts performed over the period of 3 years. The percentage of the number of grafts on Y axis and the year it was performed on X axis

The graphical representation of number of grafts performed over the period of 3 years. The percentage of the number of grafts on Y axis and the year it was performed on X axis