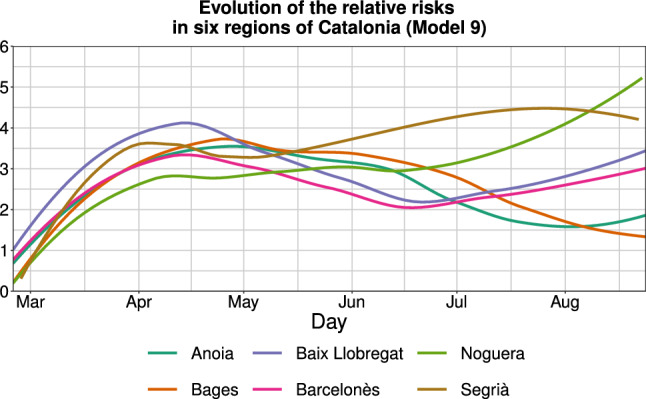
Fig. 7.

Evolution of the relative risks (computed as ), according to the estimates provided by Model 9 in the six regions of Catalonia with the highest global relative risks (according to the estimates provided by Models 3 and 4). To make this plot, the relative risks provided by Model 9 have been smoothed through a locally estimated scatterplot smoothing (LOESS) regression (Fox and Weisberg 2018) for ease of visualisation and interpretation
