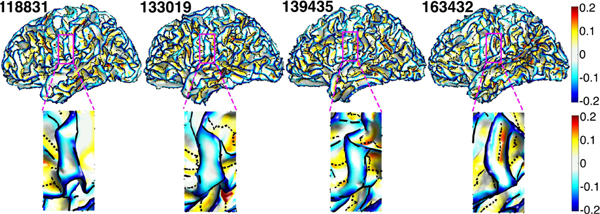
Fig. 7.
Top: gyral curves (black solid line), sulcal curves (black dashed line), and the smoothed mean curvature of four subjects. Bottom: the enlarged magenta regions of the top figures showing that there is no sulcal curve between gyral curves in the left three subjects due to shallow depth or low mean curvature).

