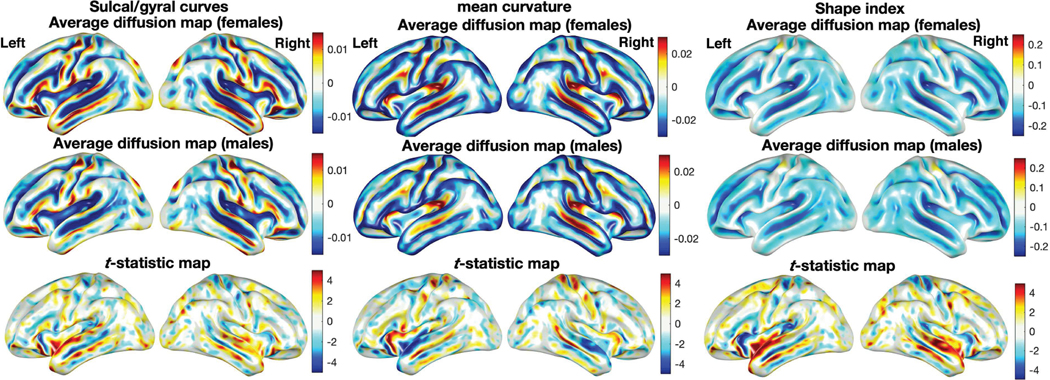
Fig. 9.
The average diffusion maps of the sulcal/gyral curves (left), mean curvature (middle) and SI (right) of 268 females and 176 males displayed on the average surface template. The T-statistic maps (bottom) show the localized sulcal and gyral pattern, mean curvature and SI differences (female - male) thresholded at ±4.96 (uncorrected p-value of 10−6), having significant difference mainly in the temporal lobe.

