Figure 2.

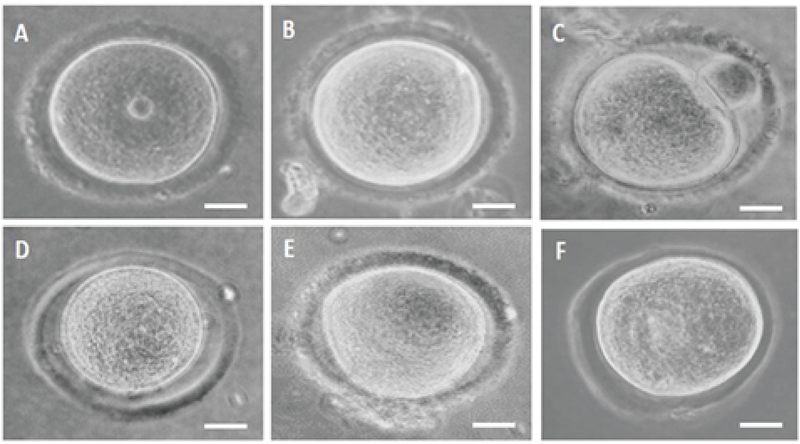
The PVS and shape change rate of oocytes in the hCCCM and control media during the IVM process. (A) Normal GV. (B) Normal MI. (C) Normal MII. (D) Large PVS. (E and F) Irregular shape and large PVS.

The PVS and shape change rate of oocytes in the hCCCM and control media during the IVM process. (A) Normal GV. (B) Normal MI. (C) Normal MII. (D) Large PVS. (E and F) Irregular shape and large PVS.