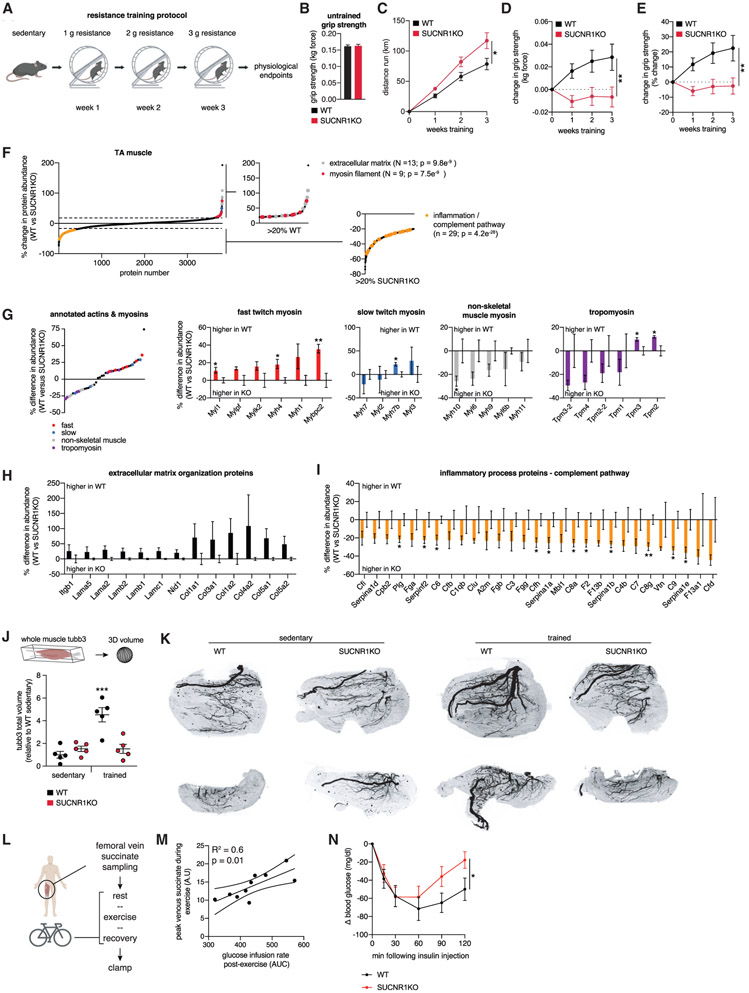
Figure 5. Muscle Adaptation to Exercise Training Requires Succinate-SUCNR1 Signaling.
(A) Resistance wheel training protocol.
(B) Grip strength of untrained WT and SUCNR1 KO mice (n = 15 WT, n = 12 KO).
(C) Distance run by WT and SUCNR1 KO mice throughout the training regimen (n = 15 WT, n = 12 KO).
(D and E) Absolute (D) and percentage (E) change in grip strength during resistance wheel training (n = 15 WT, n = 12 KO).
(F) Protein abundance differences between WT and SUCNR1 KO trained TA muscle. Pathways enriched in proteins exhibiting more than 20% differences between genotypes are highlighted (n = 4).
(G) Actin and myosin chain protein abundance differences between WT and SUCNR1 KO trained TA muscle (n = 4). Fast-twitch myosin chains are depleted in SUCNR1 KO trained TA muscle.
(H) ECM protein pathway members exhibiting decreased abundance in trained SUCNR1 KO TA muscle (n = 4).
(I) Inflammatory complement pathway members exhibiting increased abundance in trained SUCNR1 KO TA muscle (n = 4).
(J) Quantification of innervation in whole TA muscle by 3D tubb3 staining (n = 5).
(K) Representative compressed 2D projections of muscle tubb3 volume. The top row and bottom row are representative top view and side view projections, respectively.
(L) Experimental design to correlate maximal succinate release by human exercising muscle and post-exercise insulin sensitivity.
(M) Correlation between maximal femoral venous succinate concentration in human exercising muscle and post-exercise insulin sensitivity (n = 10).
(N) Insulin tolerance test of WT and SUCNR1 KO mice 3 h following acute treadmill running (n = 6–7).
Data are represented as mean ± SEM. *p or #p < 0.05, **p < 0.01, ***p < 0.005 (two-tailed Student’s t test for pairwise comparisons, one-way ANOVA for multiple comparisons involving one independent variable).

