Fig. 1.
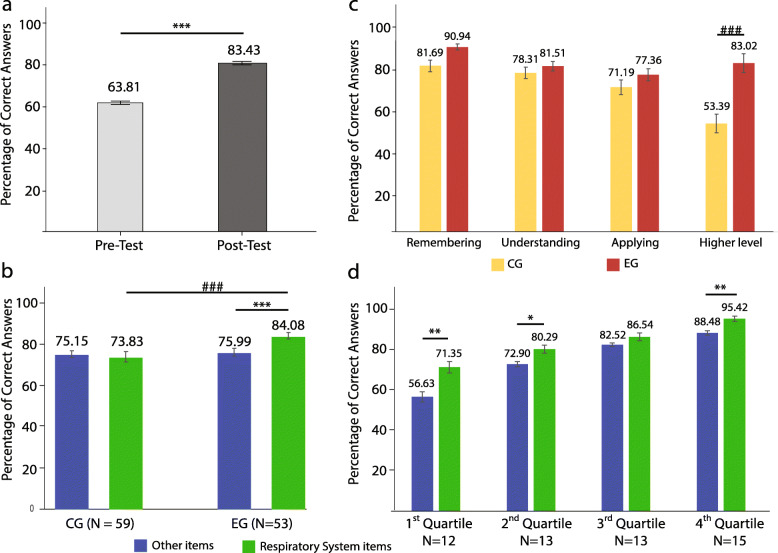
The impact of flipping the classroom on the percentage of correct answers in anatomy and physiology. a A comparison of students’ pre-test and post-test scores for the five quizzes administered for the EG (N = 53). Results are expressed as mean ± standard error of the mean (SEM) and converted into a percent class average. Before any in-class explanation or activity, students obtained an accuracy of 64% on the quizzes, showing that they had watched the videos prior to class. The active learning in class increased students’ performance by almost 20%. b Anatomy and physiology final examination average (in percent) for the EG in a flipped classroom (N = 53) was significantly higher than the average of the CG in a traditional didactic lecture (N = 59). Results are expressed as percentage of correct responses mean ± SEM on the respiratory system items compared to the other items. Improvement in scores was 8% better with flipped classroom than with didactic lecturing. Bars graphs are plotted separately by group for CG and EG. Statistically significant differences are indicated by *** Wilcoxon signed-rank test p < 0.001 and ### Mann-Whitney U test p < 0.001. c Students in a flipped classroom course (EG) performed significantly better than the previous cohort (CG) on high-order analysis multiple-choice questions in the final examination. Statistically significant differences are indicated by ### Mann-Whitney U test, p < 0.001. d Difference in students’ semester average grades between respiratory items (flipped classroom) and other items (traditional lecture) in an anatomy and physiology course for EG (N = 53). Students were divided into quartiles based on their final score on the final examination with 38–68% (1st quartile, N = 12), 69–80% (2nd quartile, N = 13), 81–85% (3rd quartile, N = 13), and 86–100% (4th quartile, N = 15). Each stratified group scored higher on the respiratory system items compared to the other items. The Wilcoxon signed-rank test was used for comparisons and significant p values are indicated. Error bars represent SEM; * < 0.05; ** < 0.01

