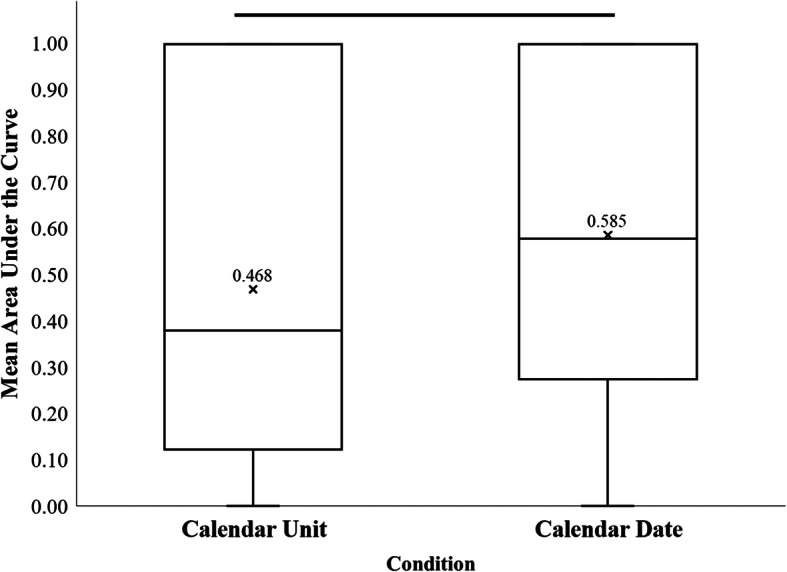
Fig. 2.

Distribution of Participants’ AuC Measures in the Calendar Unit Condition and the Calendar Date Condition. Note. The crosses indicate the mean area under the curve (AuC) value for each condition. The bold line indicates a significant difference between AuC values (p < 0.001)
