Figure 3.

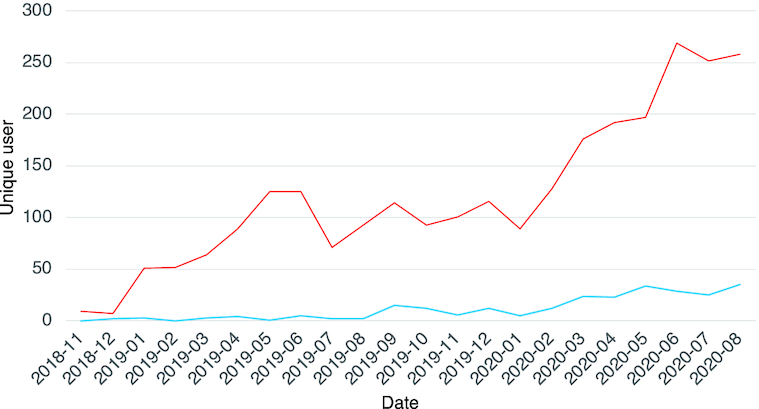
History of user access. Red line indicates the number of unique users accessed to the top page of GlycoPOST and blue line indicates the number of unique users downloaded the data stored in GlycoPOST.

History of user access. Red line indicates the number of unique users accessed to the top page of GlycoPOST and blue line indicates the number of unique users downloaded the data stored in GlycoPOST.