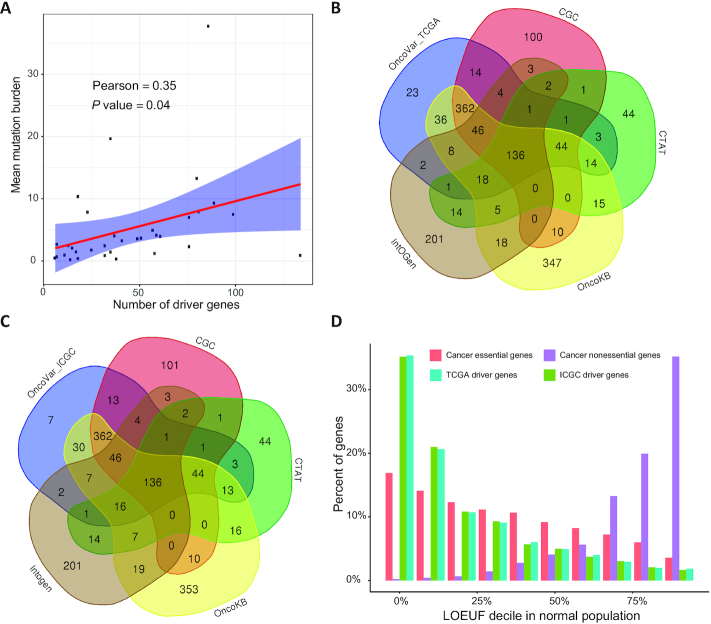
Figure 4.
Features of identified driver genes. (A). A significant positive correlation between average mutation burden in a cancer type and the number of identified driver genes. (B, C). OncoVar identified many known driver genes which are consistent with results by other methods including CGC (49), CTAT (31), OncoKB (50), IntOGen (37) and several novel driver genes. (D). Percent of genes among different loss-of-function genes observed/expected upper bound fraction (LOEUF) (28) in a normal population from gnomAD.

