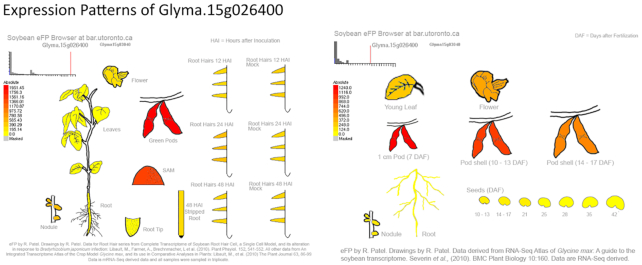
Figure 1.
eFP Graphic of Gene Expression. Gene expression of soybean gene models is graphically depicted using the eFP software at the University of Toronto. Currently, two Gene Atlas experiments are used to allow the user to visualize the general expression level of the selected gene across the sampled tissues. This is particularly useful in candidate gene identification surveys. This example displays the expression of Glyma.15G026400.

