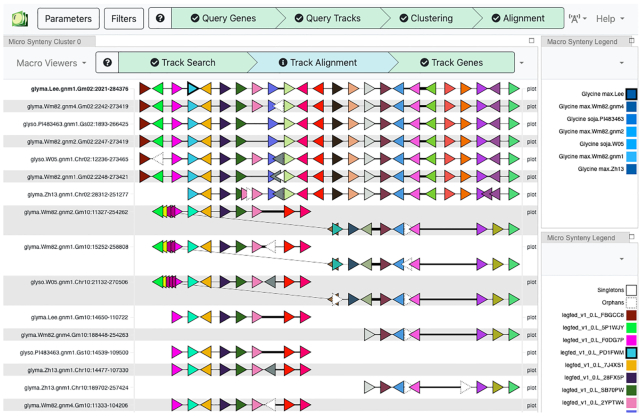
Figure 4.
Genome Context Viewer (GCV). View of gene-based synteny for seven soybean assemblies: Lee, Wm82 (v1, v2 & v4), Zhonghuang 13 and G. soja W05 and PI 483463. Each horizontal line is a region from one assembly. Colored triangles represent genes (with orientation), with colors determined by distinct gene families; thus, adjacent red triangles represent tandemly duplicated genes. Thicker line segments indicate greater genomic distance. The top seven rows are from chromosome 2, and the bottom seven rows are from the homoeologous region on chromosome 10. Inversions (diagonal lines) are evident in three assemblies on chromosome 10. Macro-synteny (chromosome-scale) views are also available.

