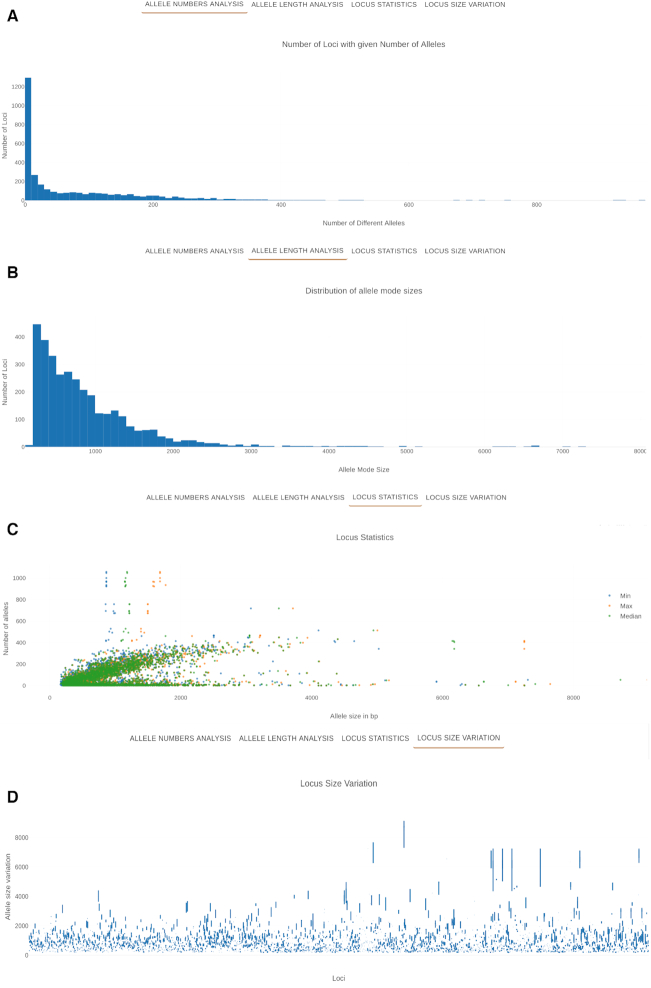
Figure 3.
Summary charts displaying relevant information on a given schema. (A) Distribution of loci by number of alleles. (B) Distribution of loci by allele mode size. (C) Representation of summary statistics (minimum allele size in blue, maximum allele size in orange and median allele size in green) for each locus. (D) Box plots of loci size distribution; the loci in the x-axis are ordered by locus ID.

