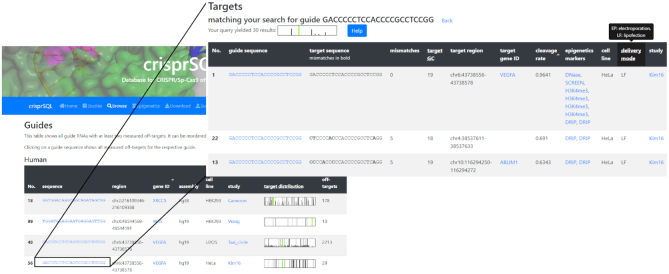
Figure 3.
Web interface of the database, showing a list of all included gRNA sequences and which, if any, GENCODE gene name they target. Their respective target distributions across the genome are visualised as a barcode-type histogram, allowing a first assessment of their reported specificity. Upon clicking on or searching for a specific guide (inset), the website shows its full reported off-target profile, i.e. gene names of target loci, cleavage rates and epigenetic markers at the target site, hyperlinked to the respective source. Clicking on a gene name opens the vicinity of the respective cut site in a genome browser.

