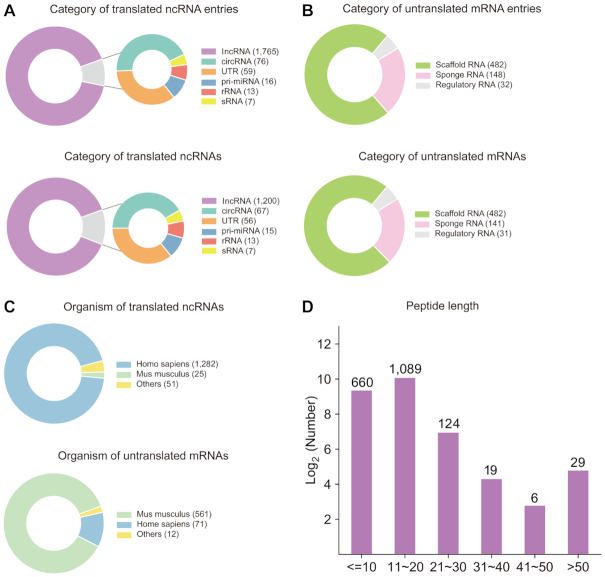
Figure 2.
Data statistics of cncRNAdb. (A) Subcategory distribution of translated ncRNA entries (upper) and ncRNAs (down). (B) Subcategory distribution of untranslated mRNA entries (upper) and mRNAs (down). (C) Organismal distribution of translated ncRNAs (upper) and untranslated mRNAs (down). (D) Sequence length distribution of peptide encoded by the translated ncRNAs.

