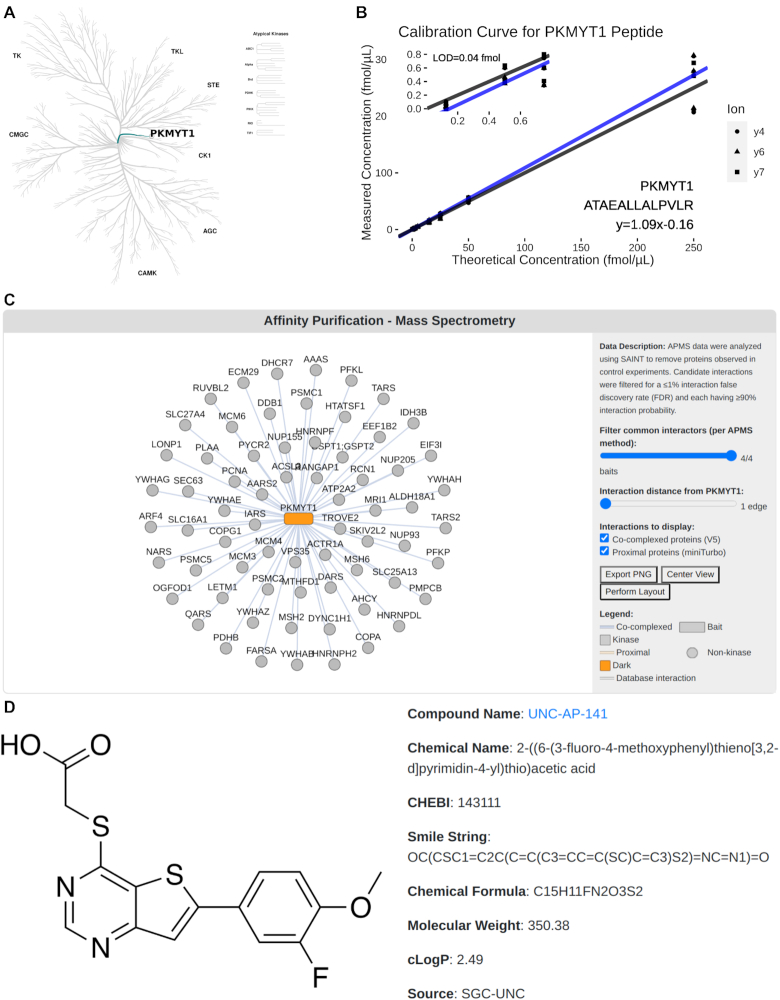
Figure 1.
Several types of data related to dark kinases are displayed on the individual kinase pages. (A) Kinase tree showing the location of PKMYT1 in the canonical kinase phylogenetic tree (3) produced using CORAL (22). (B) Calibration curve related to a PRM peptide related to PKMYT1. (C) Interactive visualization of APMS physical interaction network building using Cytoscape.js (23) for PKMYT1. (D) Display of the tool compound for kinase STK17B.

