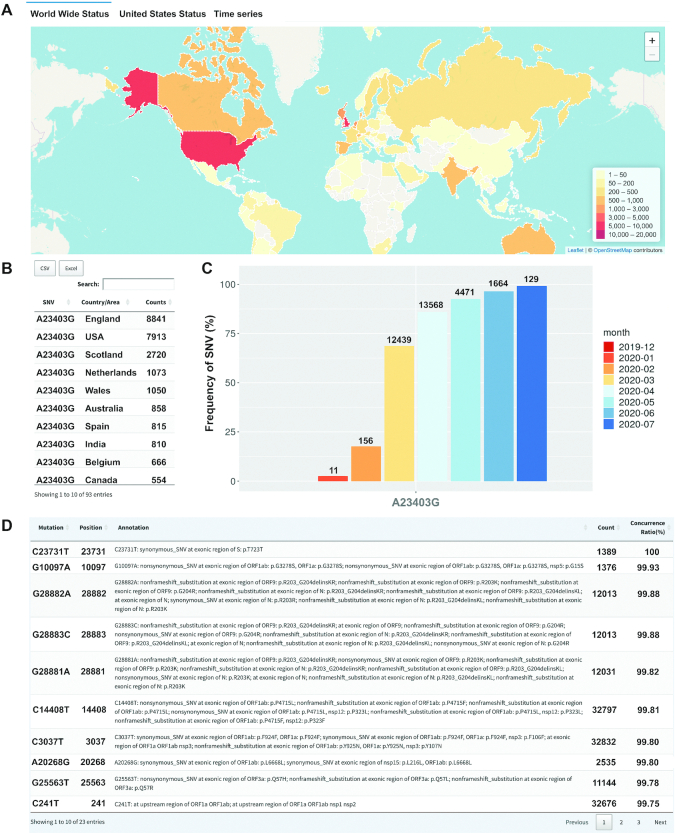
Figure 2.
An example to show the process of data mining via GESS. (A) World map of distribution of the mutation A23403G (S:D614G). (B) Table including event counts of A23403G in different counties/areas. (C) Temporal occurrence ratios of A23403G along the time. (D) SNVs in concurrence with A23403G (identified in at least 1,000 samples with the ratio larger than 0.9).

