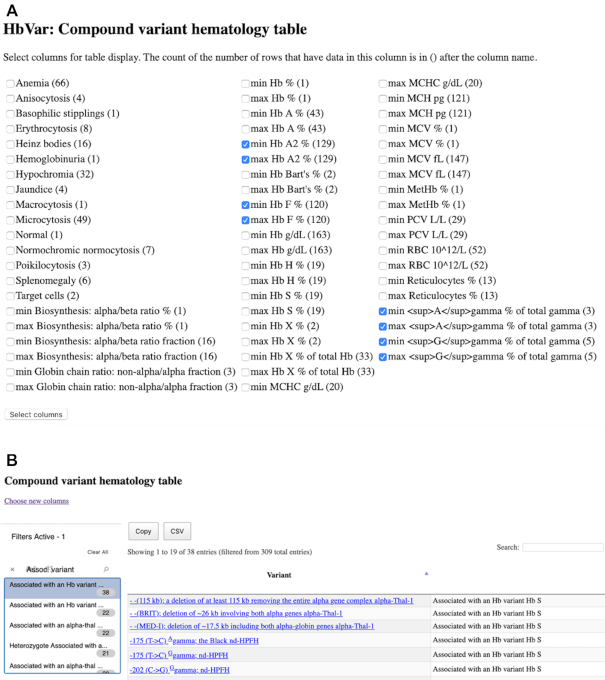
Figure 1.
The new compound heterozygotes phenotype tool of HbVar. A user can select the desired columns for the table output display from a wide variety of options, according to the available HbVar data. The count of the number of rows that have data in each column is provided in brackets after each column name (A). Upon selection of the columns, a table is generated and the user can narrow down his search by selecting the data from the filters at the left side of the page (B).

