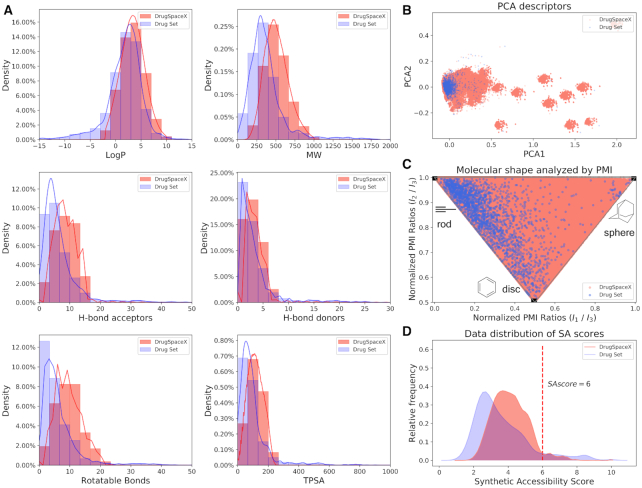
Figure 2.
Analysis of chemical properties. (A) Comparison of the property distributions for the Drug Set (blue) and DrugSpaceX (red). Relative frequencies of the descriptors logP (upper left), molecular weight (upper right), H-bond acceptors (middle left), H-bond donors (middle right), rotatable bonds (lower left), and TPSA (lower right). (B) A principal component analysis (PCA) plot comparing the chemical space defined by the DrugSpaceX databases: all compounds (red), the Drug Set (blue). (C) A molecular 3D shape analysis of the diversity of DrugSpaceX (red) and Drug Set (blue) by the principal moments of inertia. (D) Distribution of SA scores for all of the products contained in DrugSpaceX (red) and Drug Set (blue).

