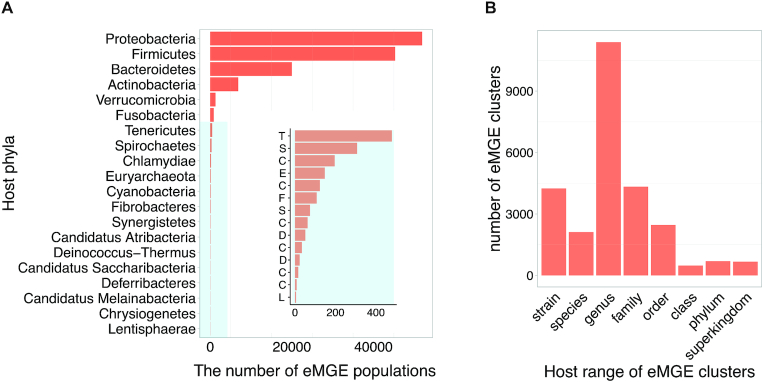
Figure 2.
The distribution of identified eMGE-hosts. (A) The number of eMGE populations associated with their corresponding bacterial and archaeal host phyla; The inset with blue background provides resolution for the low frequency bacteria host phyla and each letter on the y-axis corresponds to the first letter of host phyla's name. (B) The number of eMGE clusters distributed across different host range levels.

