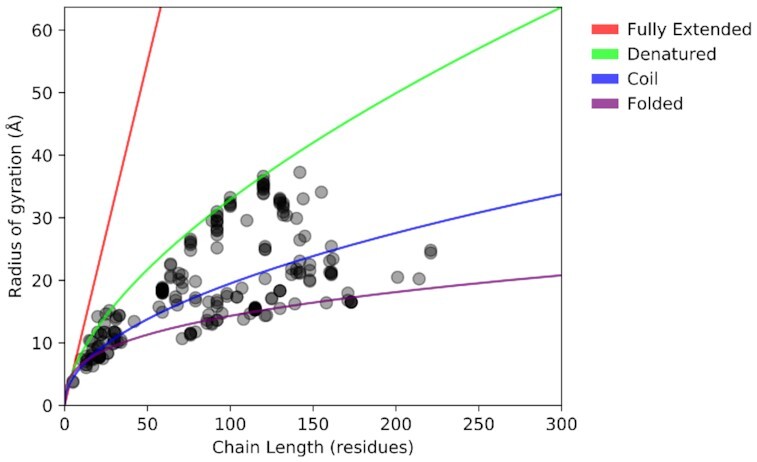
Figure 2.

Chain compactness of PED 4.0 entries. Radius of gyration of protein chains plotted against their chain length. Each dot represents a given chain in a given ensemble. The reference curves (54) represent values specific for folded proteins (purple), random coils (blue), denatured proteins (green) and fully extended chains (red). Four long folded proteins (PED00007, PED00010, PED00014 and PED00162) with over 300 residues are omitted, but fit well to the purple trend line.
