Figure 3.
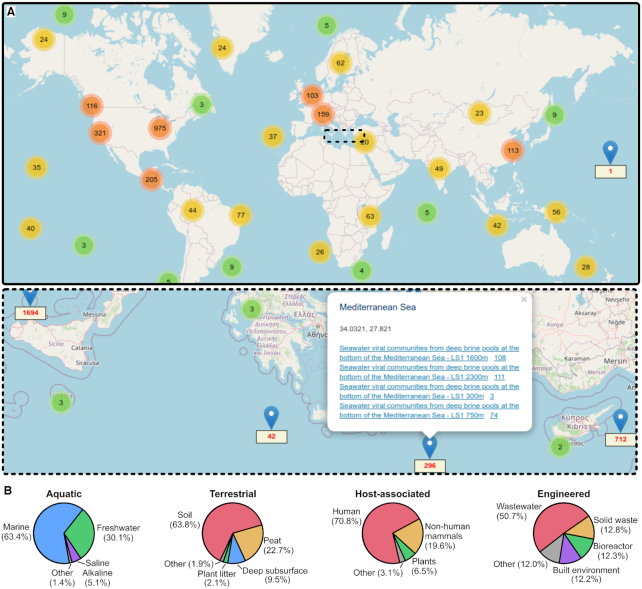
Geographical and environmental distribution of IMG/VR-online sequences. (A) Overview map of the IMG/VR v3 sequences based on the location of their original sample in IMG/M (reference sequences not currently in IMG/M are not included on the map). The two insets (bottom) display zoomed-in views of two regions with a high sample count. Colored samples indicate groups of geographic locations too close to be represented separately in the current zoom level, colored according to the number of locations, which is also indicated in the circle. Once zoomed in, individual locations are displayed using blue pins, with the number of UViGs indicated in red. Clicking on the pin brings in a new window including links to the datasets and UViGs at this location. (B) Proportion of IMG/VR v3 sequences per sample type for four major biomes. The pie charts are based on all UViGs regardless of quality, i.e. n = 1 592 032 aquatic, n = 122 133 terrestrial, n = 487 433 host-associated and n = 75 228 engineered sequences.

