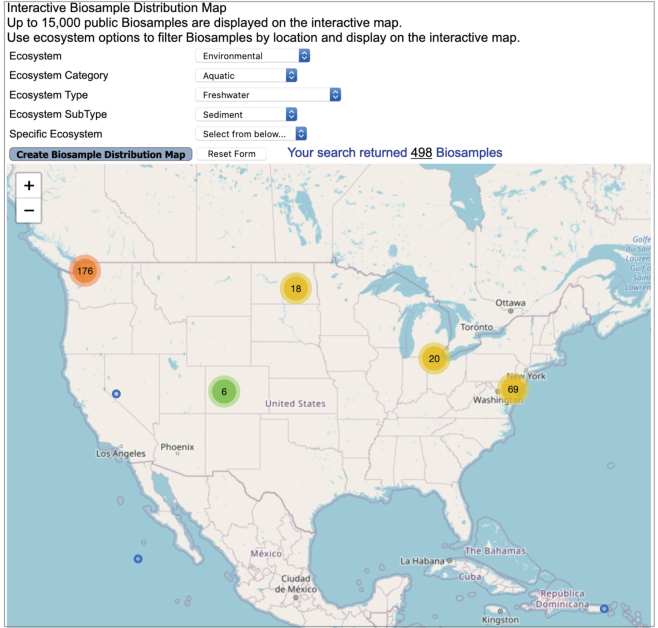
Figure 4.
Interactive Biosample distribution map. Distribution of freshwater lake Biosamples over parts of the USA and Canada. Number of Biosamples from a specific location is displayed in a heatmap format where green represents a small number of Biosamples, orange depicts a high number whereas yellow indicates an intermediate number.

