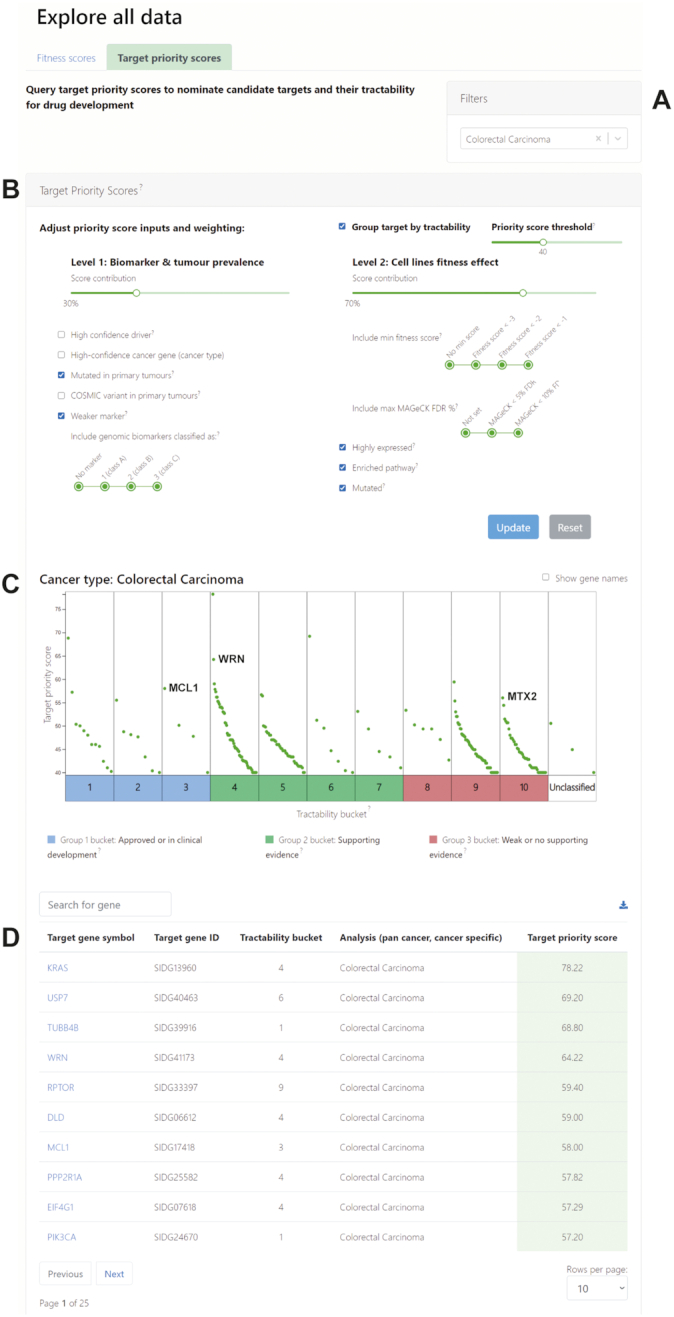
Figure 2.

Target priority scores view. Target priority scores can be accessed and explored from the Project Score home page. Scores can be filtered by (A) cancer type and further refined by (B) biomarker and tumour prevalence, and fitness effect. (C) Target priority scores are represented by a green data point and are interactively presented in a colour-coded plot, grouping targets into tractability buckets. Selected examples of priority targets are labelled. (D) Priority scores in tabular format.
