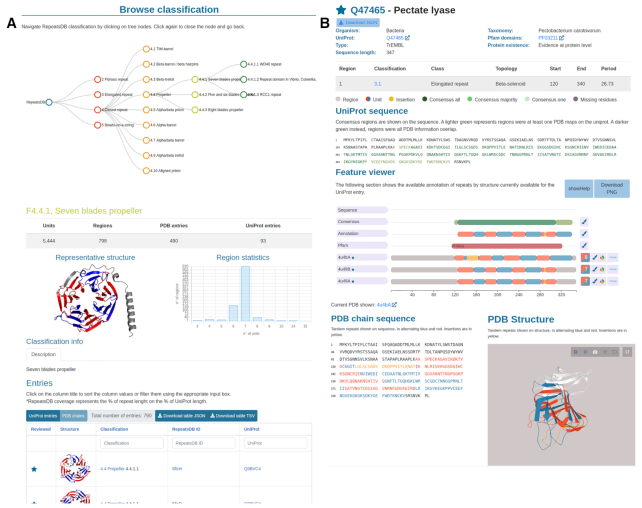
Figure 2.
(A) RepeatsDB Browse page. This features the classification tree (top) and details of the classification level selected in the tree (bottom). It includes a summary table of the level statistics, image of a representative structure, histogram of unit numbers over per region and a table including all entries belonging to the selected level. (B) UniProt entry page. This shows details of the entry and the consensus repeat annotation (top), Feature Viewer with repeat data for all PDB chains mapped to the UniProt entry (center), PDB section showing repeat data on the sequence and structure of the selected PDB (bottom).

