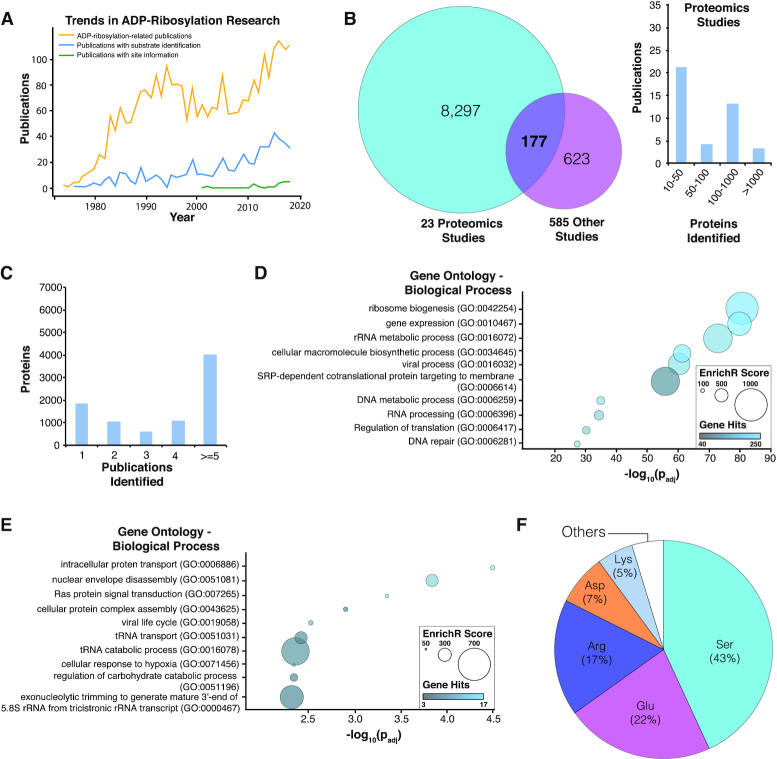
Figure 1.
Analyses of ADPriboDB 2.0. (A) Trends in ADP-ribosylation research shows a progressive increase in the number of publications about ADP-ribosylation biology, substrates and sites. (B) Left: Venn diagram shows the overlap between proteins identified in proteomics-based studies (≥10 proteins) and those identified in other publications. Right: Histogram describes the number of proteins identified by these proteomics studies. (C) Distribution of the number of publications identifying a given ADP-ribosylated substrate. (D) Proteins identified in at least two publications were subjected to gene ontology analysis via EnrichR. Bubble chart shows the enrichment of selected pathways analyzed with REVIGO (26); the full enrichment analysis is available in Supplementary Data S1. (E) Enrichment analysis was also performed on ADP-ribosylated proteins within the SARS-CoV-2 interactome. Bubble chart shows the enrichment of selected pathways analyzed with REVIGO; the full enrichment analysis is available in Supplementary Data S2. (F) Distribution of ADP-ribosylated residues.

