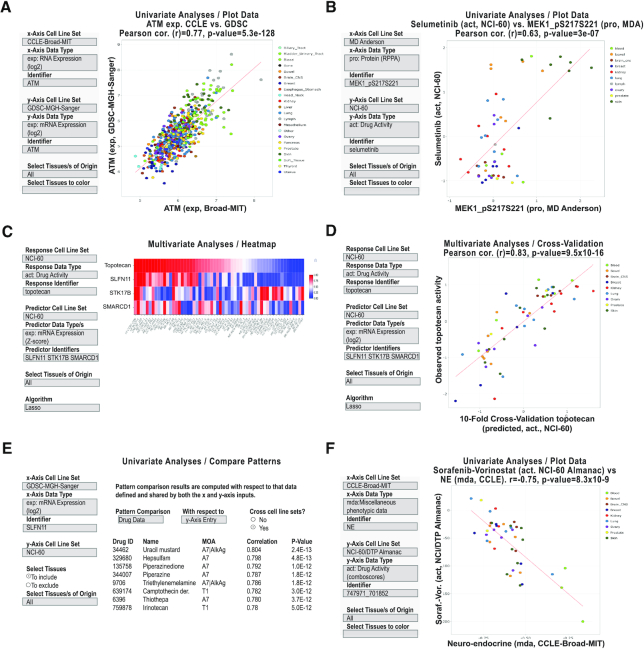
Figure 5.
CellMinerCDB analysis examples. (A) Univariate analysis scatter plot of ATM transcript expression levels as measured by CCLE (Broad) versus GDSC (Sanger/MGH). (B) Univariate analysis scatter plot of MAP2K1 (MEK1) phosphoprotein levels versus the MAP2K1 inhibitor selumetinib activity levels. (C) Multivariate analysis and heatmap to identify and visualize molecular predictors for topotecan activity. (D) Multivariate analysis cross-validation scatter plot to visualize the observed versus predicted activities. (E) Univariate analysis ‘Compare Patterns’ output to identify drugs whose activities are most significantly correlated to SLFN11 expression. (F) Univariate analysis scatter plot of the NE transcript expression signature versus the two-drug activity NCI-ALMANAC ComboScore of sorafenib–vorinostat. All examples are captured images from CellMinerCDB (discover.nci.nih.gov/cellminercdb) using the selections detailed in the input box (on the left). Each dot in the scatter plots is a cell line, with tissues of origin indicated in the legend (on right). For the scatter plots, the regression trend line is in red. The x- and y-axes, correlations (Pearson’s r) and P-values are as defined within each panel.

