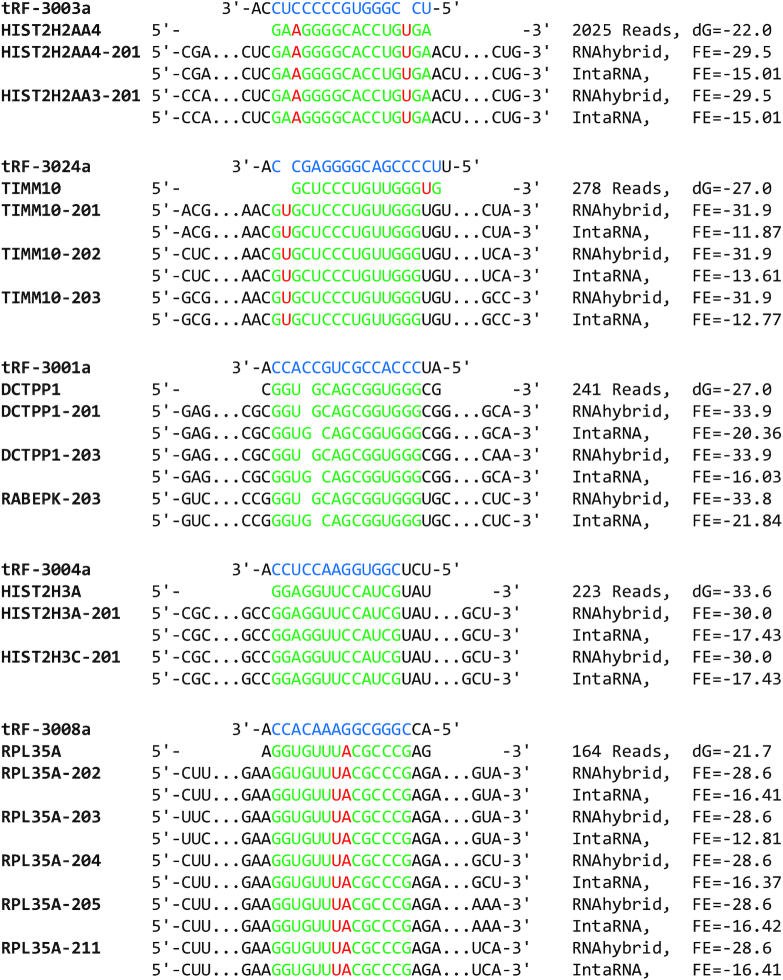
Figure 3.
Illustration of the interaction structures of tRF-3–mRNA chimeras from CLASH and the corresponding binding sites in tRFtarget. The interaction structures of tRF-3–mRNA chimeras were inferred by mfold RNA Folding Form using default settings, and the reads of the chimeras and the delta G values (dG) given by mfold are shown at the right. The binding sites in tRFtarget are shown below the mfold prediction. The transcript names are shown at the left, and the prediction algorithms and free energy (FE) are shown at the right. Black represents non-interaction sequences; blue represents interaction sequences of tRFs, green and red represent paired and non-paired bases of mRNA, respectively. CLASH, cross-linking, ligation and sequencing of hybrids.

