Figure 3.
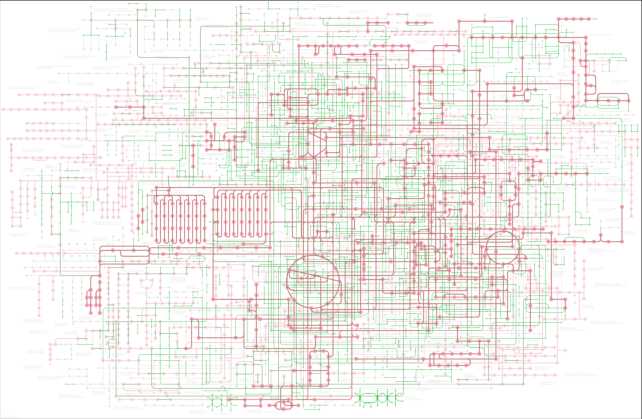
The global map of metabolic pathways can now be viewed in two modes: normal link mode and the module link mode, the latter treating the map as consisting of modules rather than individual genes or KOs. Here the global map of a Tara Oceans sample (T30798_01100) is shown in the module link mode with the coloring of pink for the background of all modules, green for mapped genes, and brown for complete modules identified in the sample.

