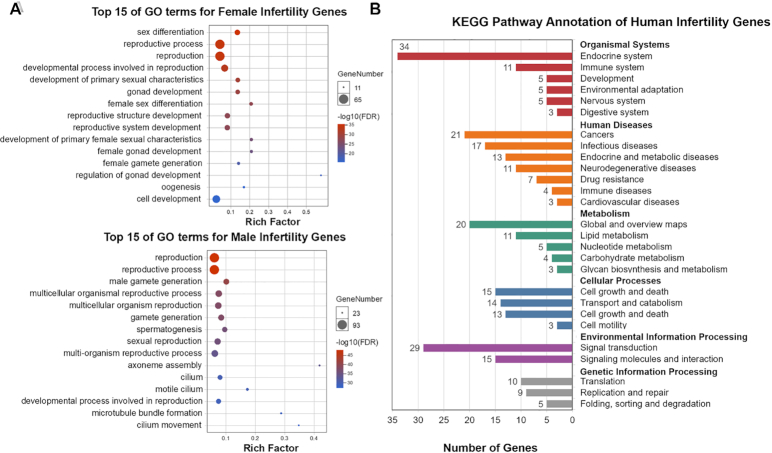
Figure 2.
Enrichment analysis for human infertility gene sets. (A) Gene Ontology (GO)-based functional annotation of female/male infertility gene sets and enrichment analysis. The X-axis represents the rich factor corresponding to the GO term, and the Y-axis represents the name of the GO term. The color of the dot represents the size of the q-value. The smaller the q-value, the closer the color is to blue. (B) Kyoto Encyclopedia of Genes and Genomes (KEGG) Pathway annotation of human infertility gene sets: for each gene in each disease category, records with a total frequency >2 are displayed in this histogram.

