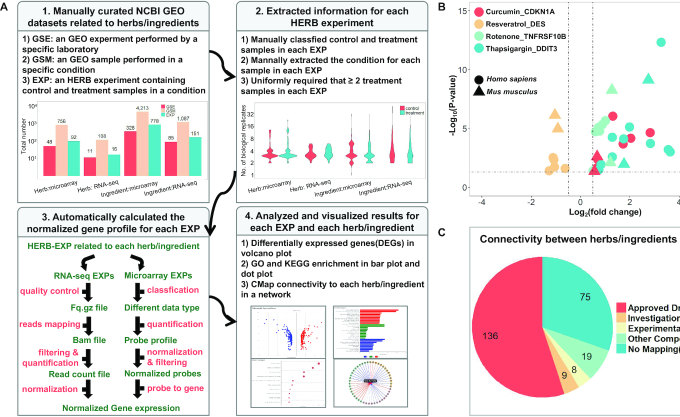
Figure 1.
Construction and characterization of HERB-EXP. (A) A schematic diagram of the data processing framework in HERB-EXP in four consecutive steps: 1. download data from GEO experiments (GSE) and samples (GSM), extract HERB experiments (EXP) for each herb/ingredient, and show the number of GSE/GSM/EXPs for each data type in bar plots. 2. For each EXP, illustrate the number of biological replicates for control and treatment samples in violin plots. 3. Automatically analyze RNA-seq and microarray data according to different pipelines for each EXP first, and then merge results from multiple EXPs together for each herb/ingredient. 4. Visualize the results of differential expression analysis, GO and KEGG enrichment, or CMap connectivity for each EXP, and then for each herb/ingredient, in volcano plot, bar plot, dot plot or network respectively. (B) The differential expression of four known targets (CDKN1A, DES, TNFRSF10B and DDIT3) for four TCM ingredients (curcumin, resveratrol, rotenone, and thapsigargin) in multiple EXPs related to these ingredients are shown in volcano plots. The X-axis shows the expression change compared to control samples and the Y-axis shows statistical significance. The four colors correspond to four target-ingredient pairs, and the two shapes indicate the species information for each EXP (mouse/human). (C) Classification of all herbs/ingredients with HERB-EXP data, according to their mapped compounds in CMap.

