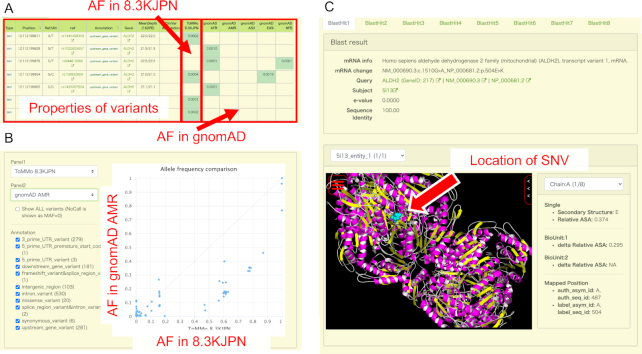
Figure 3.
(A) Example of a search result table when a user searches for genomic variants on the ALDH2 gene. The basic properties of the variants are displayed on the left side of the table, and the allele frequency (AF) in 8.3KJPN and gnomAD populations are displayed on the right side. (B) Comparison of 8.3KJPN and gnomAD AMS (Admixed American) using genomics variants on ALDH2 gene as an example by the AF comparison tool. In the scatter plot on the right of the figure, one dot corresponds to one SNV, and the horizontal and vertical axes represent the frequency of each SNV at 8.3KJPN and gnomAD AMR, respectively. Users can freely change populations displayed as horizontal and vertical axes using the selector at the top left. The SNVs displayed on the scatter plot can be filtered using functional annotation of each SNV. (C) The Structure Mapping page displays the available protein structure data for a particular SNV. If multiple isoforms of RefSeq are mapped on an SNV, we choose a representative isoform by alphabetically sorting their descriptions and selecting the first isoform, e.g. if the isoforms of a gene are numbered, ‘transcript variant 1’ is selected. ‘BlastHit’ tabs can be used to switch the structures of different protein sequences, and they are sorted by descending BLAST scores. Identical protein sequences in the whole PDB are grouped into a single BlastHit tab, and each entity (unique sequence in a PDB entry) in the group can be selected using the ‘PDB entity’ dropdown list. The ‘Chain’ dropdown list can be used to highlight the substituted amino acid of each chain. Below the ‘Chain’ dropdown list, the secondary structure and ASA of the residue is shown. The ASA of each residue is normalized by the ASA of the same residue type ‘X’ in an extended Gly-X-Gly conformation (Relative ASA). ‘delta Relative ASA’ is the difference in Relative ASA of a residue between in the state where each protein chain is isolated and in the state of biological unit. The MolMil viewer can be used to interactively indicate the positions of the substituted amino acid in the 3D structure.

