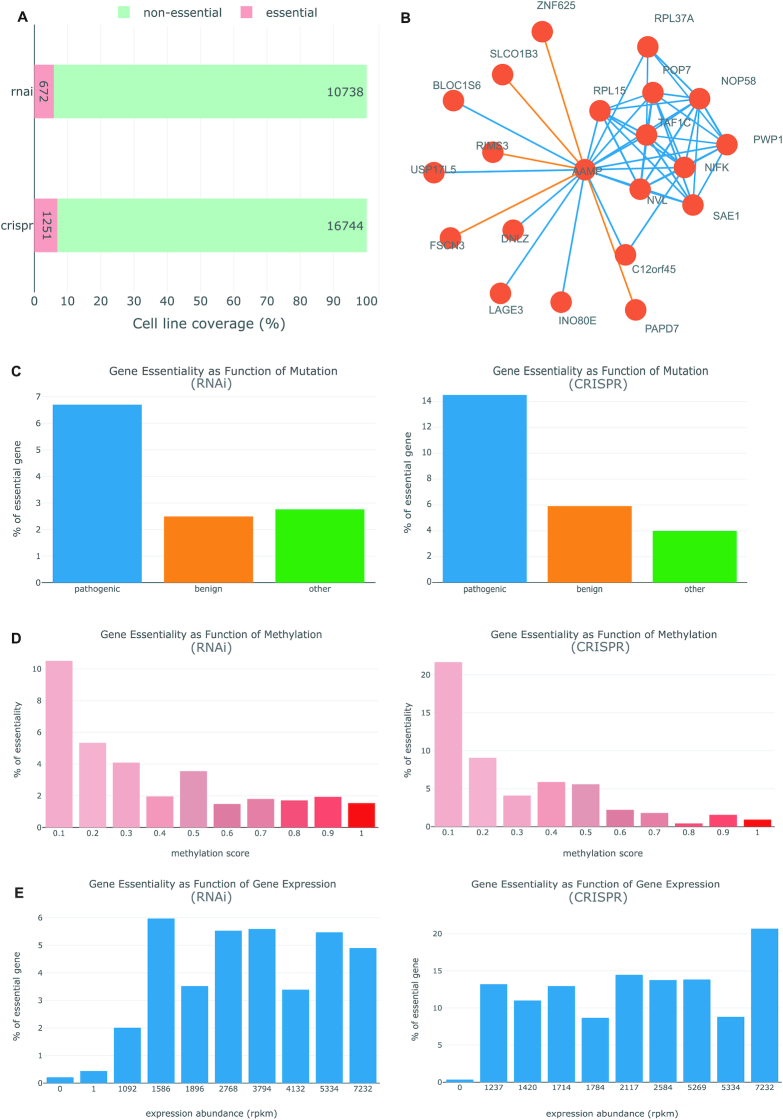
Figure 2.
Extensive annotations on human essential genes provided by OGEE v3. Shown here are graphical visualizations taken from the OGEE v3 (https://v3.ogee.info/#/cellline/large%20intestine/RKO/summary). (A) gene essentiality determined using different experimental methods. (B) Correlational co-essentiality chart of AAMP gene from central nervous system tissue tested by CRISPR-Cas9 technique. The orange edges denote negative correlation while the blue edges denote positive correlation among the connected genes. (C) Gene essentiality as function of mutation: mutation outcomes predicted using FATHMM were used to group all tested genes into three categories, the percentage of essential in each group was then calculated (please consult ‘Help’ page for more details); left panel: gene essentiality tested using RNAi, right panel: gene essentiality tested using CRISPR–Cas9. (D) Gene essentiality as function of methylation: genes are grouped based on methylation sites and calculate percentage of essential for each sites; red color gradient is used to denote the methylation score, increasing gradually from 0 to 1; users can select any methylations from the drop down menu. (E) Gene essentiality as function of gene expression: all 0 rpkm genes are in the first bin and rest of the genes are assigned into equal size nine bins; lastly, percentage of essential is calculated for each bin.

