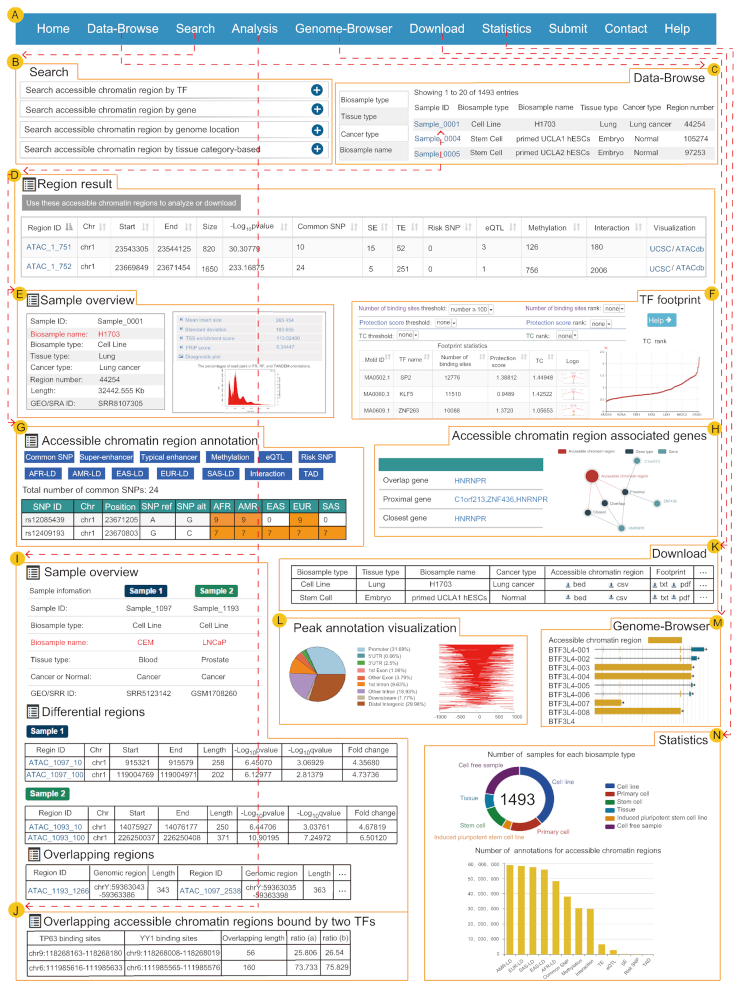
Figure 2.
The main functions and usages of ATACdb. (A) The navigation bar of functions in ATACdb. (B) Users can query chromatin accessibility regions through four paths: ‘Search by genomic region’, ‘Search by tissue type’, ‘Search by TF name’ and ‘Search by gene name’. (C) Browse samples. (D) Table of search results including region ID, chr, start, end, size, -log10P value, common SNPs, super-enhancers, typical enhancers, risk SNPs, eQTLs, DNA methylation sites, 3D chromatin interactions and visualization (genome browser). (E) Sample information including biosample name, biosample type, tissue type, cancer type, region number, length, GEO/SRA ID and QC report. (F) The detailed information of TF footprint. (G) The detailed interactive table of annotation information. (H) Accessible chromatin regions associated genes are identified through three strategies. Network diagram about these regions is displayed. (I) Analysis of differential and overlapping accessible chromatin regions between two samples. (J) Analysis of overlapping accessible chromatin regions bound by two TFs. (K) Data download. (L) Visualization of peak annotation. (M) Genome browser. (N) Sample and annotation statistics in ATACdb.

