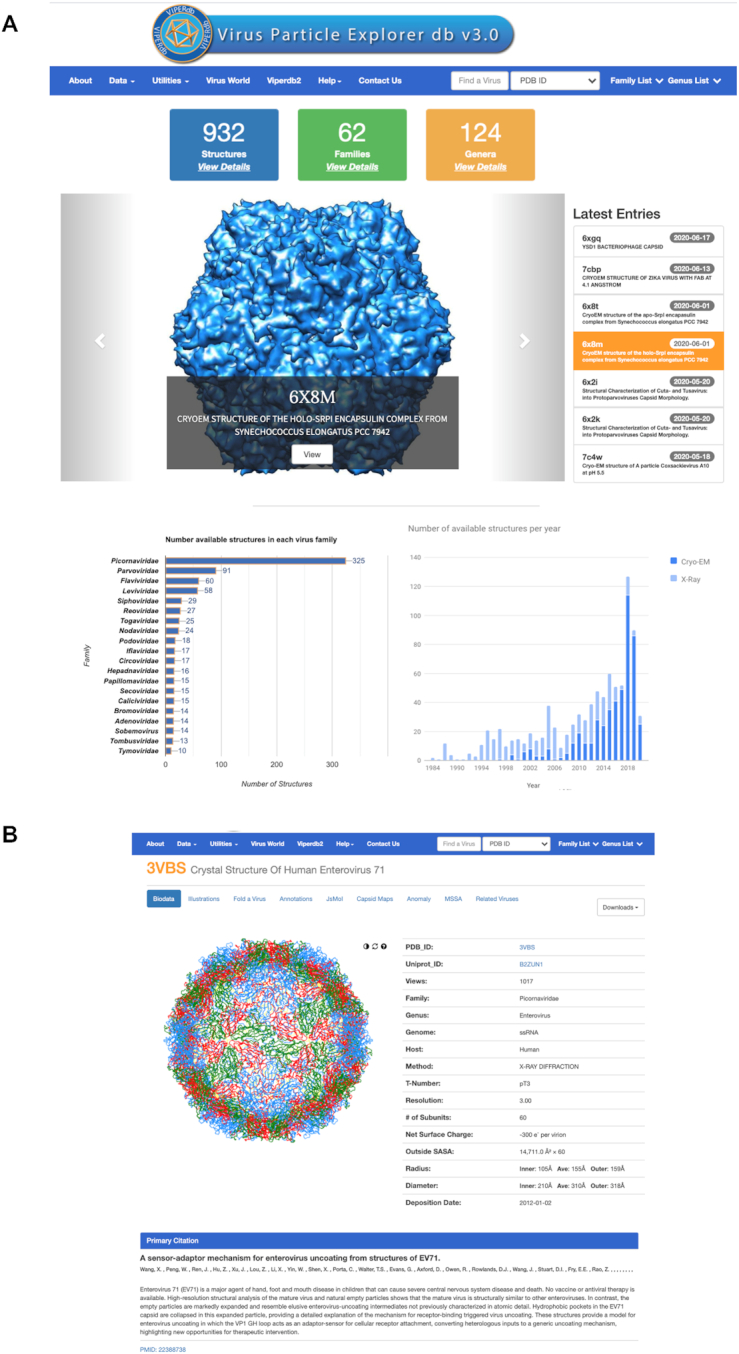
Figure 2.

Graphical layouts at VIPERdb v3.0. (A) Top of the main page showing various items in the menu bar and the statistics of total number of structures in the database along with the number of virus families and genera they belong to. Below that is a window showing the pictures and list of a few latest structures in the database. On the bottom left is a bar graph showing the number of structures available in each virus family. The list of structures in the family can be accessed by clicking on the corresponding bar. On the bottom right is a plot of number of virus structures determined by X-ray crystallography and cryo-electron microscopy (cryo-EM) in each year. The full-length of the bars corresponds to the total number of virus structures (Y-axis) determined in each year (X-axis), while the extent of the light and dark blue regions of the bars indicate the number of structures determined by X-ray crystallography and cryo-EM respectively. (B) An example info_page of Human Enterovirus 71 (PDB-ID: 3VBS).
