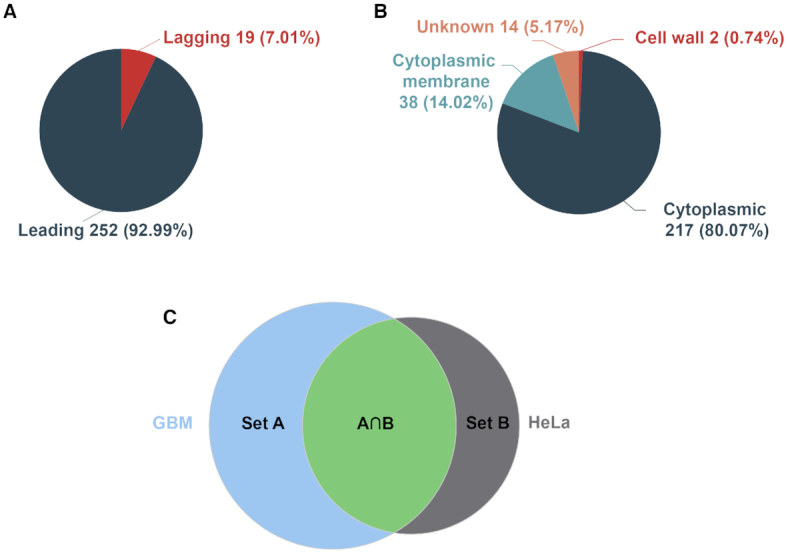
Figure 2.

Screenshots of some analysis modules in DEG 15. (A) Distribution of essential genes between leading and lagging strands and (B) distribution of sub-cellular localizations of essential genes in the Bacillus subtilis genome. (C) A Venn diagram showing the intersection and the union between two datasets (GBM and HeLa cells). The diagrams are clickable to show a list of genes with detailed information.
